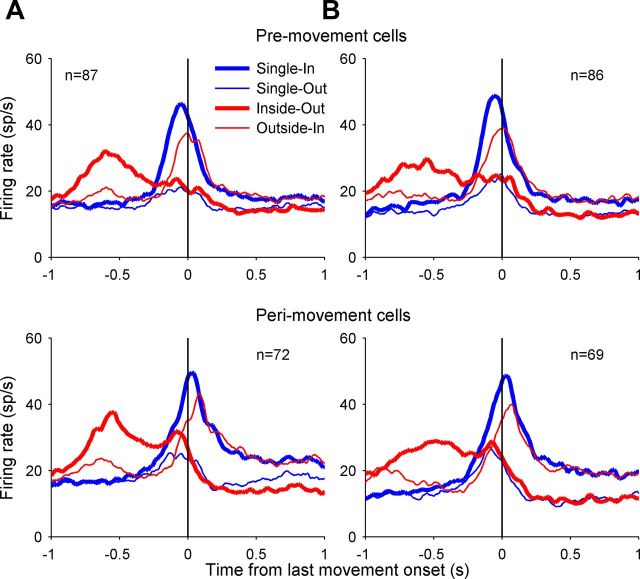
Figure 11.
Comparison of population activity of area 5d cells between single-reach trials and the second movement of double-reach trials in the central fixation (A) and free-view conditions (B). Top, Bottom, Mean firing rates for the premovement and perimovement cells, respectively. Each panel plots the population activity for Single-In (blue thick line), Single-Out (blue thin line), Inside-Out (red thick line), and Outside-In (red thin line) conditions. Unlike Figures 4 and 7, the activity curves for the double-reach trials are aligned to the second movement onset.

