
Figure 8.
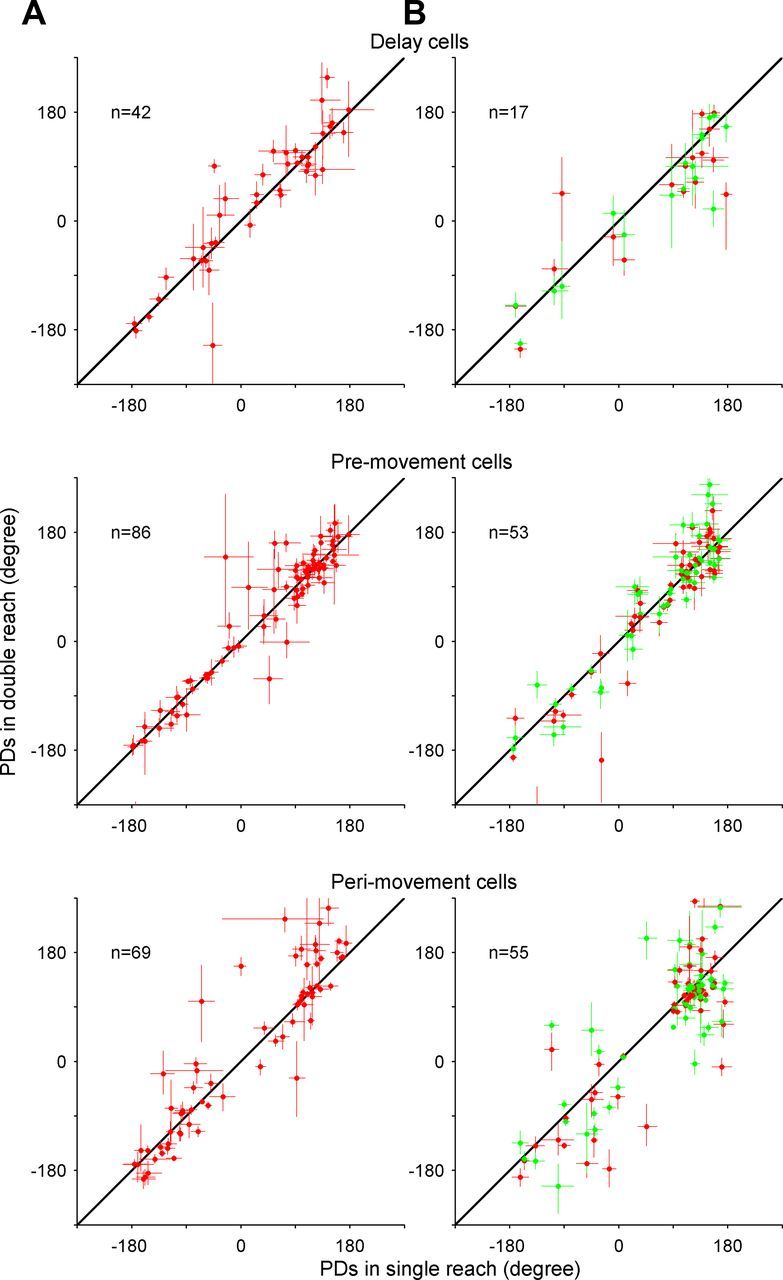
PDs in single-reach trials versus those of the first movement in double-reach trials for area 5d cells recorded in the free-view condition (A) and Reach-2-from-3 condition (B). Scatter plots comparing the PDs of single- and double-reach trials in delay, premovement, and perimovement periods, respectively. The red dots indicate that the second target was CCW to the first target, while the green dots represent CW displacement. The length of the bar on each circle represents the SE.