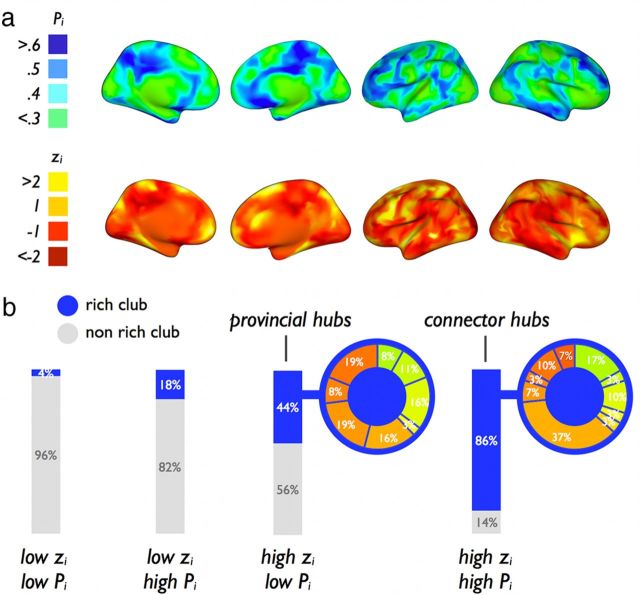
Figure 6.
Participation index and within-module z-score of nodes. a, Structural–functional participation index Pi (top row) and the within-module degree degree z-score zi (bottom row) of each node of the network (maps are spatially smoothed for visualization). b, Categorizing the nodes of the network based on their Pi and zi score and the involvement of rich club and nonrich club nodes in each of these categories. Figure shows a strong involvement of rich club nodes in the “connector hubs” of the network (high Pi, high zi) expressing a high level of within-module connectivity and a diverse connectivity profile across RSNs.

