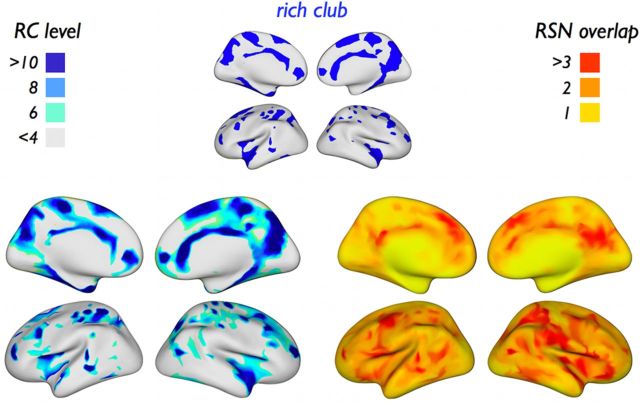
Figure 7.
Rich club level and RSN overlap. Left, Rich club level projected on a reconstruction of the cortical surface. Right, Level of “RSN overlap” for each structural node of the network, expressing the number of RSNs in which a node is (proportionally) involved. Comparison shows that, in many cases, areas of RSN overlap coincide with regions that have a high rich club level (see Results). (Maps are spatially smoothed for visualization.)

