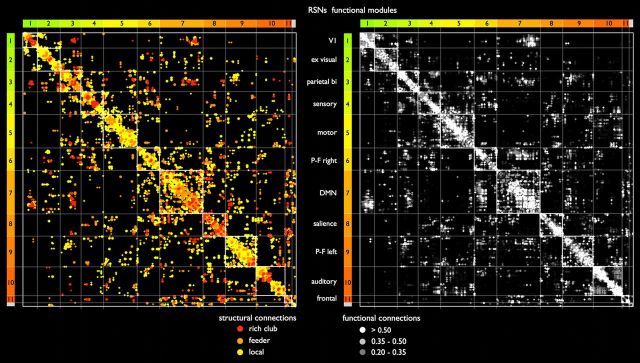
Figure 8.
Structural and functional connectivity matrices. Side-by-side plot of the group-averaged structural and functional connectivity matrix. Network nodes in both the structural (left) and functional (right) matrix are arranged according to their “winner-take-all” assignment to each of the 11 functional RSNs. Existing entries within the matrix are marked by colored dots to allow the comparison of structural and functional connections across matrices. Colored bars to the left and top of the matrices indicate RSN assignment (compare with Fig. 4). RSNs are ordered according to their level of inter-RSN connectivity, with RSNs showing high levels of interconnectivity appearing closer to the center of the matrix. Left, Structural connections, color coded according to their connection class. Right, Connection strengths of strong positive functional couplings between nodes of the network depicted in grayscale.

