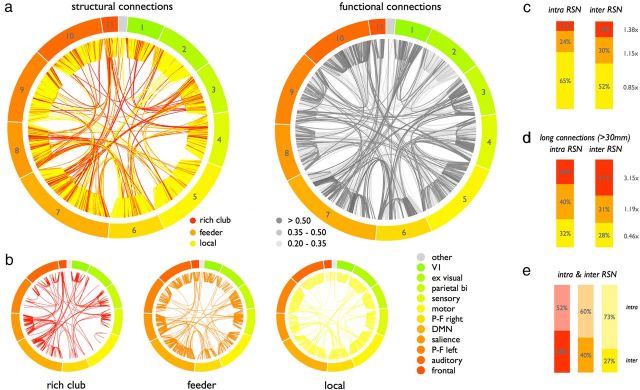
Figure 9.
Rich club, feeder, and local intra-RSN and inter-RSN connectivity. a, Side-by-side plot of the long-distance (>30 mm, corresponding to the statistics presented in d) structural and functional connections arranged in the same node ordering. Left, Long-distance inter-RSN and intra-RSN connections, color-coded according to their connection class. Right, Connection strengths of strong positive functional couplings between all network nodes depicted in grayscale. b, Panels show the connections of a divided up according to their connection class. c, Distribution of rich club, feeder, and local connections over the two classes of intra-RSN and inter-RSN connections. d, Distribution of intra-RSN and inter-RSN connections, excluding connections crossing between spatially adjacent RSNs (examining only connections with a length >30 mm). e, Distribution of intra-RSN and inter-RSN connections split out according to connection class.

