Figure 9.

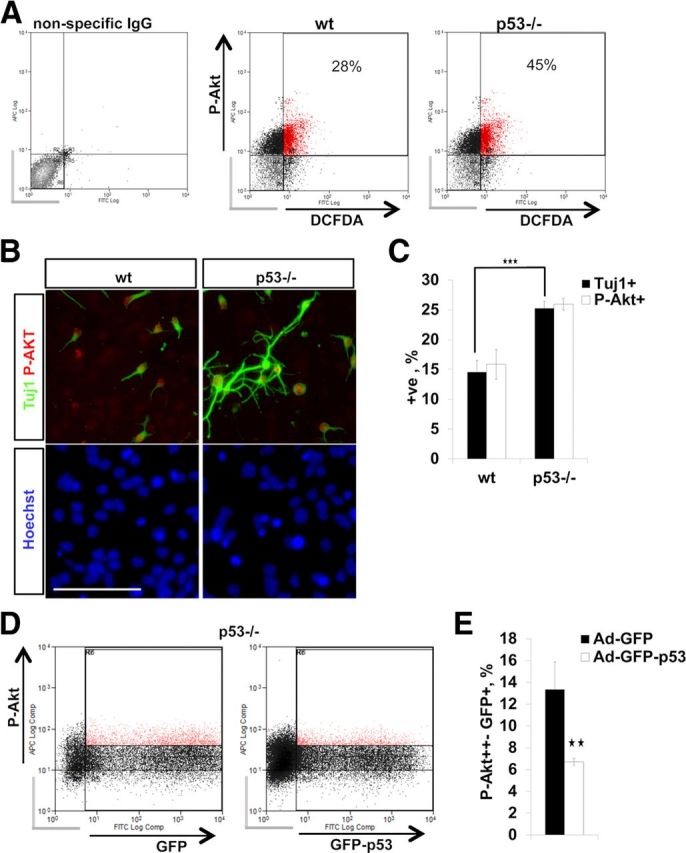
A, FACS of E13 in vitro NPCs for the ROS indicator DCFDA and for P-Akt. p53−/− NPCs exhibit an increase in P-Akt/DCFDA double-positive cells and an increase in the total number of P-Akt+ NPCs. Background signal (nonspecific IgG-stained NPCs; gray bars) was used to set the threshold for signal detection. Percentages show P-AKT/DCFDA double-positive cells. Three independent experiments with similar results were performed. A representative experiment is shown. B, Double immunocytochemistry for Tuj1/Akt phospho-S473 on differentiating wild-type (wt) and p53−/− NPCs (DIV 5). Scale bar, 100 μm. C, The bar graph shows quantification of P-Akt- and Tuj1-positive cells (B). p53−/− differentiating NPCs display an increase in both P-Akt- and Tuj1-positive cells. Data represent the mean percentage of positive cells ± SD from three independent experiments. D, FACS for P-Akt after transduction of p53−/− NPCs with Ad-GFP-p53 or control Ad-GFP (18 h). E, The bar graph shows a decrease in the number of P-Akt+ NPCs after Ad-GFP-p53 transduction compared to control Ad-GFP. Values represent the mean percentage of GFP+/P-Akt+ strongly double-positive cells normalized to GFP+ cells ± SEM from three independent experiments. Gray bars indicate cells not positive for GFP+/P-Akt. ★★p < 0.01; ★★★p < 0.001 (two-tail Student's t test).
