
Figure 2.
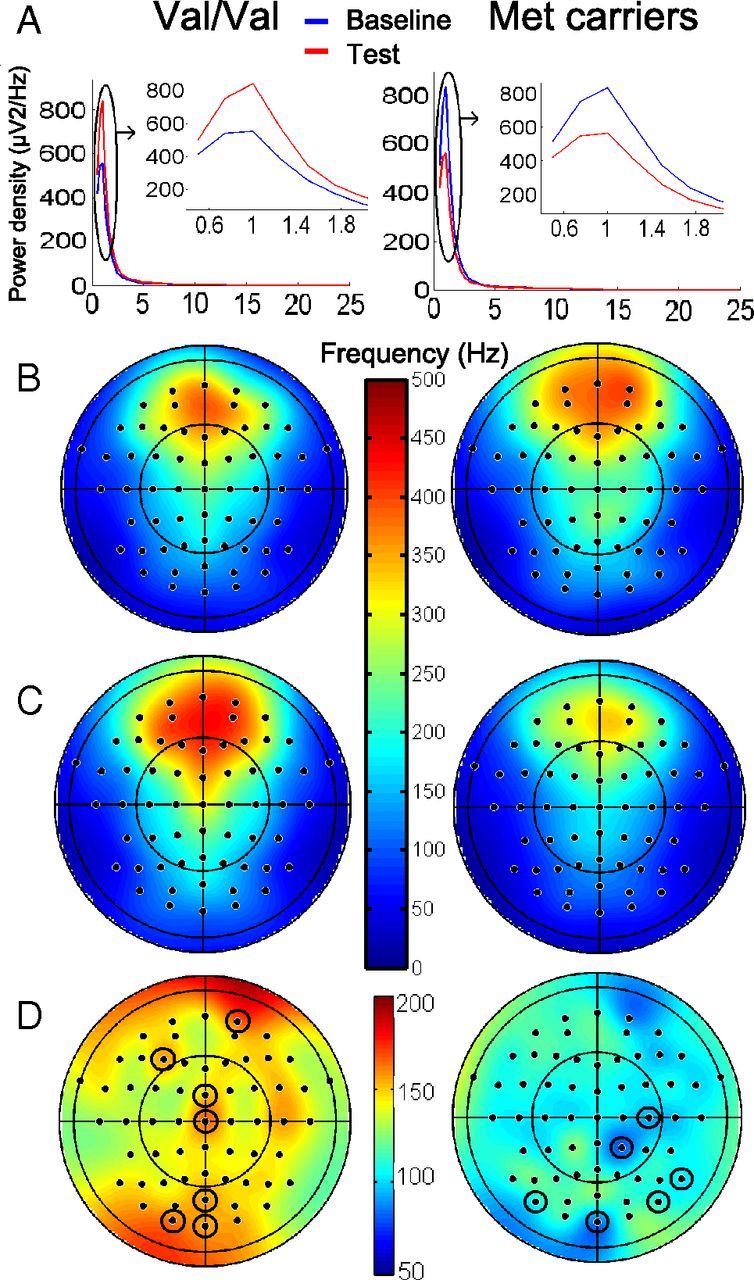
Sleep EEG spectral analysis. A, Spectral density (0.5–25 Hz) on Fp2 (one of the electrodes that showed significant changes) during Q1 in baseline (blue) and test nights (red). Insets, 0.5–2 Hz. SOP increases between baseline and test nights in Val/Val individuals. Topography of SOP (0.75–1 Hz) during Q1 of baseline (B) and test night (square microvolts) (C). D, Percentage between-night differences. Circled electrodes, p < 0.05, Bonferroni's corrected. Left column, Val/Val; right column, Met carriers.