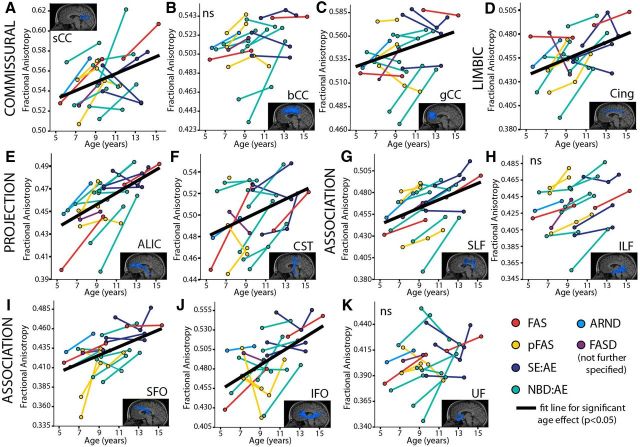
Figure 3.
FA of 11 major white matter tracts (A–K) in the FASD group (n = 17); colors indicate diagnostic categories under the FASD umbrella. Mixed-models analysis shows 8/11 tracts had age-related increases of FA (as shown by best fit lines) with the exception of the bCC (B), ILF (H), and UF (K). Increases of FA are expected over this age range in typical development.

