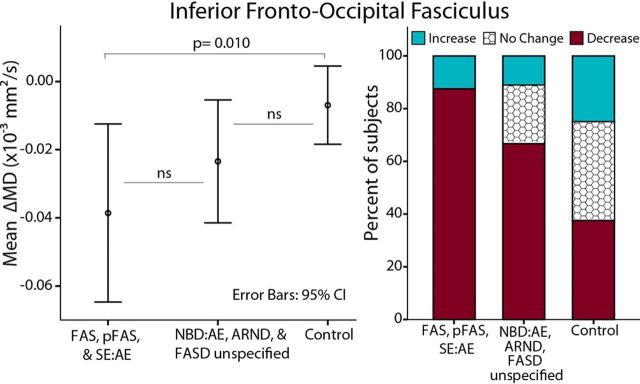
Figure 7.
Change in MD of the IFO between scans by diagnostic subgroup. Relatively greater ΔMD between scans is observed in the more severe diagnostic categories (FAS, pFAS, SE:AE, n = 8) followed by less severe (NBD:AE. ARND, FASD unspecified, n = 9) and finally controls (n = 27), despite similar mean ages (10.3 ± 2.3; 9.4 ± 1.5; 10.3 ± 1.7), mean years between scans (3.4 ± 0.9; 3.0 ± 0.5; 3.6 ± 0.9), and mean reading standard scores (95 ± 10; 91 ± 15; 112 ± 13) and math scores (91 ± 12; 89 ± 15; n/a) among these three groups, respectively.

