
Figure 9.
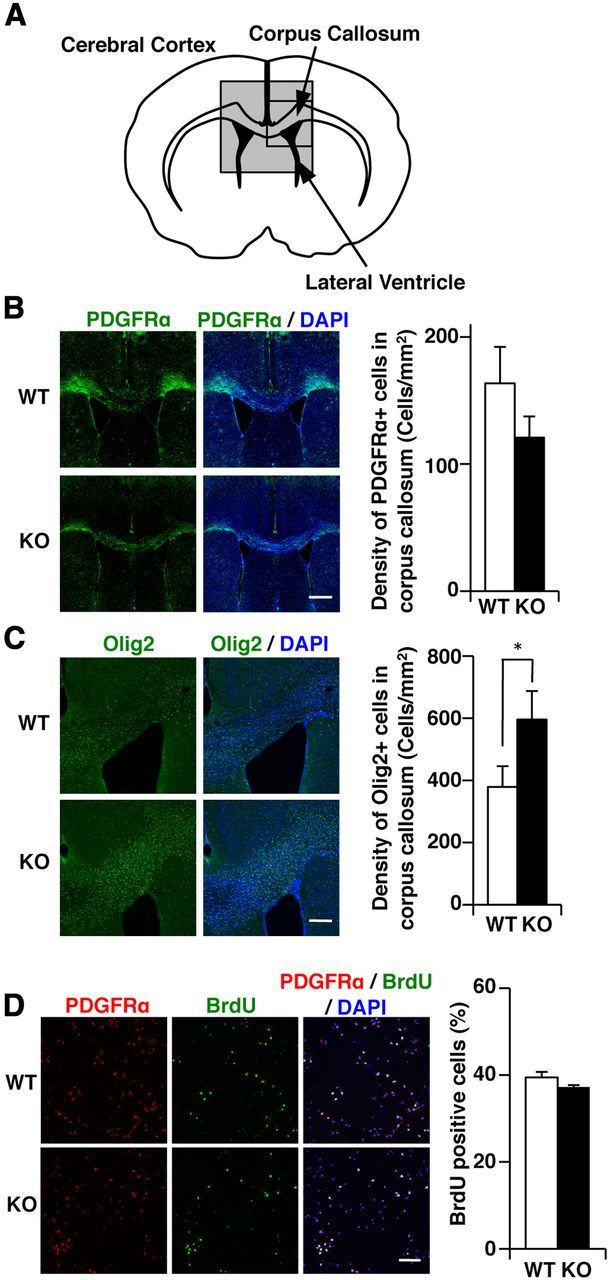
Lower accumulation of oligodendrocyte precursor cells in GnT-IX-deficient mice. A, Schematic diagram of a coronal section of the corpus callosum in the mouse brain. The enclosed regions were observed by immunohistochemical analyses. B, C, After 8 weeks of cuprizone treatment, brain sections from wild-type (WT) and GnT-IX-deficient (KO) mice were stained with anti-PDGFRα (B) and anti-Olig2 (C) antibodies. Nuclei were counterstained with DAPI (blue). Scale bars, 500 μm. The right graphs show quantification of the PDGFRα-positive and Olig2-positive cells in the corpus callosum. The data shown are means ± SEM (n = 6). *p < 0.05. D, Oligodendrocyte precursor cells were purified from WT and GnT-IX-deficient (KO) neonatal mice, cultured for 3 d, and then labeled with BrdU to identify proliferating cells. Scale bar, 100 μm. The right graph shows the percentages of BrdU-positive cells among the PDGFRα-positive cells. The data shown are means ± SEM (n = 3).