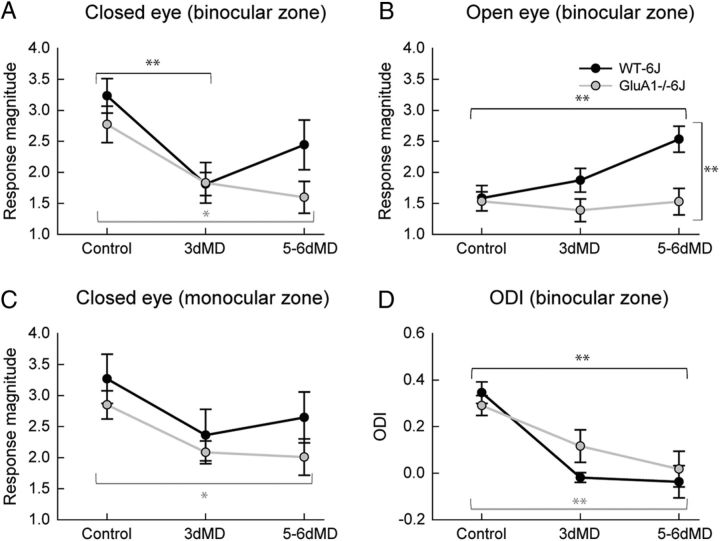
Figure 3.
In C57BL/6 mice, open eye potentiation is impaired in GluA1−/− genotype. A, Binocular zone response to contralateral eye stimulation. B, Binocular zone response to ipsilateral eye stimulation. C, Monocular zone response to contralateral eye stimulation. D, Ocular dominance index. Response magnitudes before and after MD for WT-6J (black line) and GluA1−/−6J (gray line) mice. Note that depression occurs normally after 3 d MD in the GluA1−/−6J mice but the modest response recovery in WTs at 5–6 d in the closed eye response is clearly absent in GluA1−/− mice (A) and there is no potentiation of the open eye response (B). WT: control, n = 7; 3 d MD, n = 7; 5–6 d MD, n = 6; GluA1−/−6J: control, n = 7; 3 d MD, n = 7; 5–6 d MD, n = 7. Vertical brackets refer to comparisons between genotypes (t tests) and horizontal brackets within genotype but between time points. *p < 0.05, **p < 0.01; black, WT comparisons; gray, GluA1−/− (unpaired t tests).

