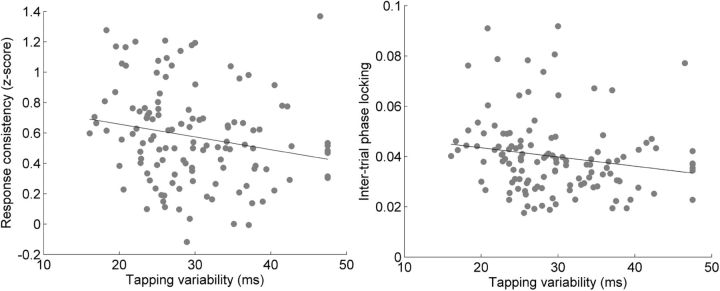
Figure 4.
Scatterplots of tapping variability versus neural response consistency (left) and intertrial phase locking (right). Tapping variability inversely correlated with neural response consistency (r = −0.204, p < 0.05) and with intertrial phase locking (r = −0.183, p < 0.05). Lower variability indicates better tapping performance.

