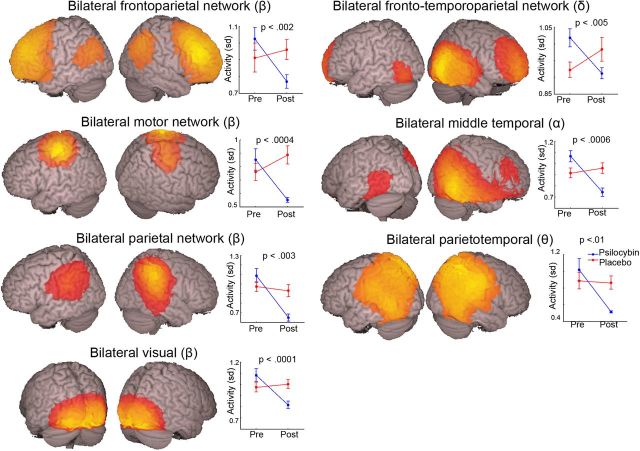
Figure 4.
The estimated spatial distribution of seven resting-state networks that were significantly modulated (p < 0.01) by psilocybin. Network structures are superimposed onto the MNI template brain. These independent components were thresholded at 0.2, and the frequency band used to derive each map is indicated by the relevant Greek letter. The right-hand graphs show the SD of the temporal expression of each independent component for both the placebo and psilocybin conditions. This can be interpreted as a measure of activity in the relevant frequency band for the relevant network. The p value reflects the interaction term in a 2 × 2 repeated-measures ANOVA. Pre, Before; Post, after.

