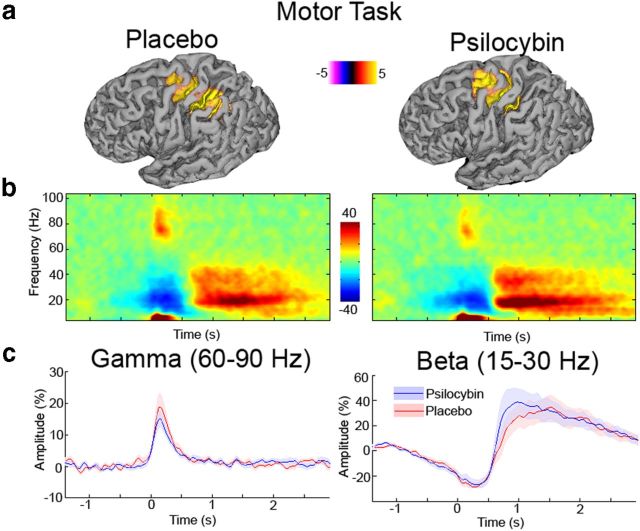
Figure 7.
a, Grand-averaged source activity for movement-related gamma (60–90 Hz) activity (p < 0.05, corrected) following administration of either placebo or psilocybin. The grand-averaged peak source location for each was located in Brodmann area 4. b, Grand-averaged time–frequency spectrograms showing source-level oscillatory amplitude changes following index finger movement (movement onset at time = 0). Spectrograms are displayed as the percentage change from the prestimulus baseline and were computed for frequencies up to 150 Hz, but are truncated here to 100 Hz for visualization purposes. c, Envelopes of oscillatory amplitude for the gamma (60–90 Hz) and beta (15–30 Hz) bands, respectively. No significant differences were seen between placebo and psilocybin for these envelopes.

