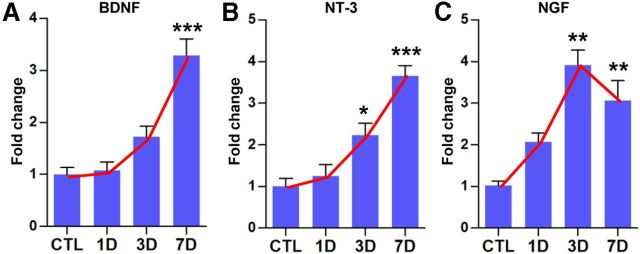
Figure 3.
Neurotrophin gene expressions in DRGs after SNI. Quantification graphs of real-time RT-PCR for BDNF (A), NT-3 (B), and NGF (C). DRG samples were obtained before [control (CTL)] and 1, 3, and 7 d after SNI. Red lines were drawn to emphasize the temporal gene expression pattern that was very similar to that of inflammatory mediators (see Fig. 2). n = 3–5 animals for each time point. *p < 0.05, **p < 0.01, and ***p < 0.001 compared with control values by one-way ANOVA, followed by Tukey's post hoc analysis.

