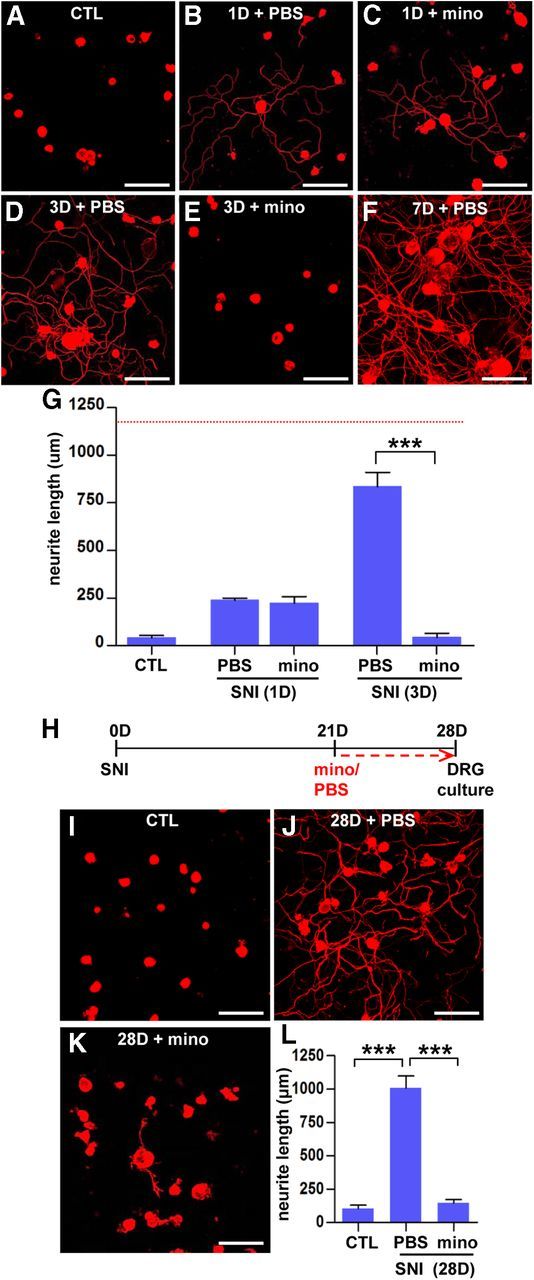
Figure 8.

Macrophages may play a role in maintaining enhanced regenerative capacity. A–F, Representative images of βIII-tubulin-positive cultured DRG neurons. DRGs were freshly dissected from sham control (CTL; A), animals at 1 d after preconditioning SNI with PBS (B) or minocycline (mino; C), and animals at 3 d after preconditioning SNI with PBS (D) or minocycline (E) and cultured for 15 h. A representative image of cultured neurons isolated from animals at 7 d after preconditioning SNI with PBS (the same group of animals in Fig. 5B) is shown for comparison (F). A dotted red line indicates the average neurite outgrowth value in animals at 7 d after preconditioning SNI with PBS that were generated for the experiments in Figure 5A–C. G, A quantification graph of the mean neurite outgrowth per neuron in each group. ***p < 0.001 by one-way ANOVA, followed by Tukey's post hoc analysis. n = 3 independent experiments for each group. H, A time schedule for the delayed minocycline infusion experiment. I–K, Representative images of cultured DRG neurons from sham control (I), SNI with PBS (J), and SNI with minocycline infusion groups (K). L, A quantification graph of the mean neurite length per neuron in each group. ***p < 0.001 by one-way ANOVA, followed by Tukey's post hoc analysis. n = 3 independent experiments for each group. Scale bars, 100 μm.
