Figure 9.

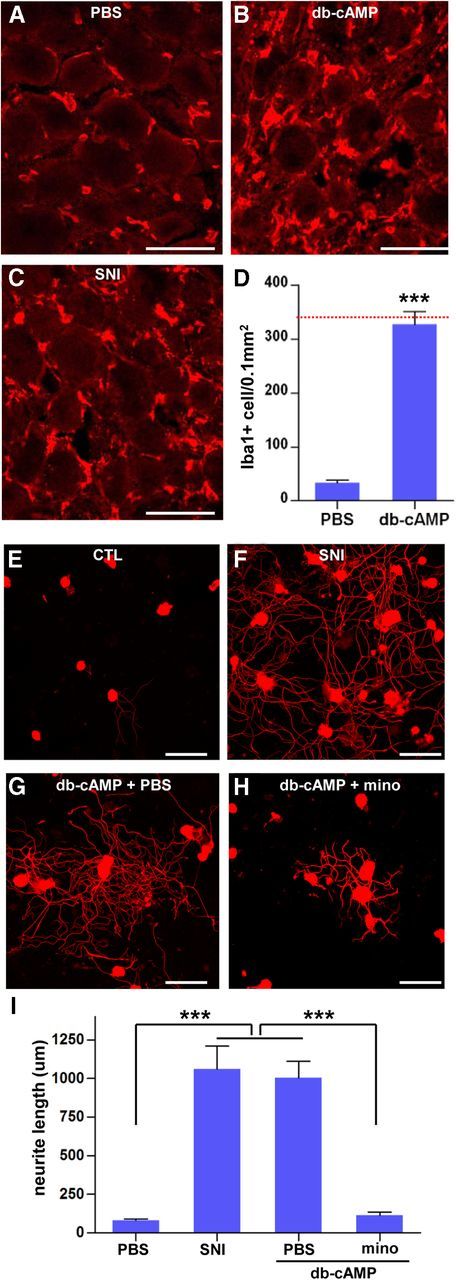
Intraganglionic cAMP analog injection increased the number of macrophages. A–C, Immunofluorescence images of DRG sections stained with Iba1 antibody. L5 DRGs were obtained 7 d after intraganglionic PBS (A) or db-cAMP injection (100 mm, 2 μl; B). C, An image of a DRG obtained after with preconditioning SNI (7 d) is shown for comparison. Scale bars, 50 μm. D, A quantification graph comparing the mean number of Iba1-positive macrophages between the DRGs with PBS or db-cAMP injection. n = 5 animals per group. A red line marks the value of the mean macrophage number 7 d after preconditioning SNI (Fig. 1G). ***p < 0.001 compared with PBS control value by one-way ANOVA, followed by Tukey's post hoc analysis. E–H, Representative images of DRG neurite outgrowth assays. L5 DRGs were obtained from animals without any manipulation [control (CTL); E], with preconditioning SNI 7 d earlier (F), or with db-cAMP injection to the L5 DRGs together with infusion of PBS (G) or minocycline (mino; H). Scale bars, 100 μm. I, A quantification graph of the mean neurite length of cultured DRG neurons in the designated experimental groups. n = 3 independent cultures from three separate animals for each group. ***p < 0.001 by one-way ANOVA, followed by Tukey's post hoc analysis.
