Figure 1.
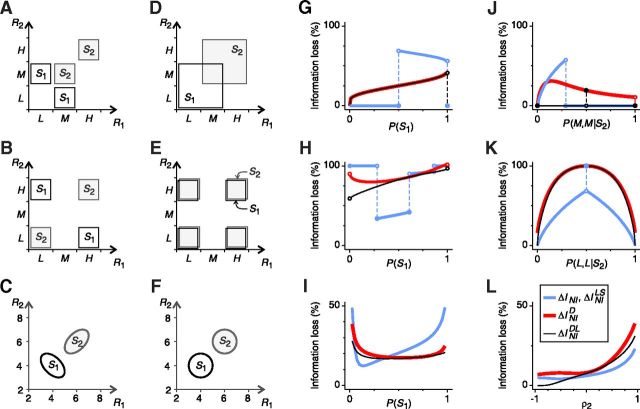
Previous estimations of ΔINIMin are tighter or looser depending on the context. A–C, Examples of the simultaneous activity of two neurons elicited by two stimuli: S1 (black) and S2 (gray). A, B, Two population responses per stimulus. Responses to S1 are negatively correlated and responses to S2 are positively correlated. C, Populations responses have Gaussian distributions with mean values μ1 = [4,4] and μ2 = [6,6], variance equal to 1, and correlation coefficients ρ1 and ρ2 (for stimulus S1 and S2, respectively). D–F, Surrogate NI population responses (see Materials and Methods). Because of the NI assumption, response distributions associated with different stimuli overlap. However, here we show that overlaps do not necessarily imply that information is lost (see text). For each example, ΔINIMin was estimated using four estimators: ΔINI, ΔINILS, ΔINID, and ΔINIDL (criteria 8a–8d). G–L, Variations of the estimations with: the stimulus probabilities (G–I), the response probabilities given S2 (J, K), and the correlation coefficient ρ2 (L). Only parameters specified in the x-axis are varied; the remaining parameters are constant. None of the estimators consistently lies below the others for all stimulus and response probabilities. Therefore, none of them constitutes a universal limit to the inefficiency of NI decoders and, depending on the context, they all overestimate, to a lesser or greater extent, the importance of noise correlations in neural decoding. Remaining parameters are as follows: in G, P(M,L|S1) = 0.5 and P(H,H|S2) = 0.5; in H, P(H,L|S1) = 0.8 and P(H,H|S2) = 0.5; in I, ρ1 = −0.9 and ρ2 = 0.7; in J, P(M,L|S1) = 0.5 and P(S1) = 0.25; in K, P(H,L|S1) = 0.5 and P(S1) = 0.5; in L, P(S 1) = 0.2 and ρ1 = −0.9.

