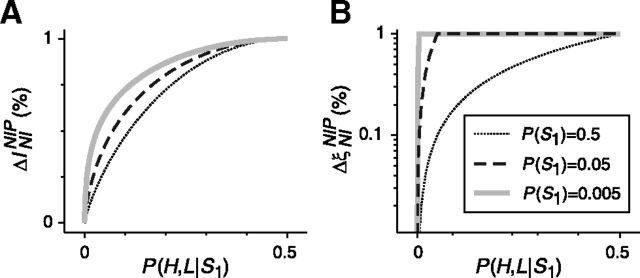
Figure 6.
Difference between assessing the role of noise correlations using mutual information or decoding error. The population response shown in Figure 5C is decoded using the classical NI decoder. Response probabilities are set according to P(H,L|S1) = P(L,L|S2). For different stimulus probabilities P(S1), A shows the variation of the minimum information loss ΔININIP relative to the encoded information I(R;S), and B shows the variation of the increment in the minimum decoding error ΔξNINIP relative to the minimum decoding error ξMin(R;S). The decoding error is here measured as decoding-error probability. The curves for P(S1) = p are identical to the curves for P(S1) = 1 − p (0 ≤ p ≤ 1). A, Unlike the case shown in Figure 4B, here, information is only partially lost and the loss depends on the stimulus and response probabilities. The maximum loss, however, only occurs when P(H,L|S1) reaches 0.5 regardless of the stimulus probability. B, Unlike ΔININIP, ΔξNINIP approaches its maximum value when P(H,L|S1) is greater or equal to P(S1).

