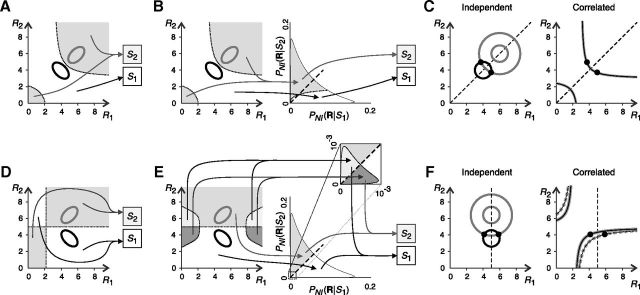
Figure 7.
Impact of ignoring noise correlations when decoding population responses with Gaussian distributions. In both examples, black and gray ellipses represent the contour curves of the response distributions elicited by two stimuli, S1 and S2, respectively. Stimuli are equally likely. Response parameters are as follows: μnk = 5 + (−1)k (A–C) and μnk = 5 + (1 − n)k (D–F); σnk = 1, ρ1 = −0.5, and ρ2 = 0.5 (Eq. 42). A, D, Optimal decoding strategy (minimization of the decoding-error probability) when correlations are known (Eq. 13). White regions are decoded as S1 and gray regions as S2. B, E, Optimal decoding strategy when correlations are ignored (Eq. 31). The arrows show the transformation of the population response R throughout the decoding process, as described in Figure 3. Population responses (left) are first transformed into vectors of NI likelihoods RNIL (Eq. 19; middle). The distinction between regions filled with different gray levels is preserved. B, Optimal NI decoder maps the white region in the middle panel onto S1 and the gray region onto S2, thus decoding population responses in the same way as in A. E, The first transformation merges population responses that are decoded differently in D (compare the regions), thus incrementing the minimum decoding error. The optimal NI decoder maps white and light-gray regions in the middle panel onto S1 and gray and dark-gray regions onto S2. In both B and E, the optimal estimation criterion differs from the maximum likelihood (or maximum posterior) criterion, which maps regions above and below the diagonal (middle, dashed line) into S2 and S1, respectively. C, F, Analysis of the responses R that can be merged, after the NI assumption, without information loss. Left, Contour curves of the NI likelihoods PNI(R|S1) (black) and PNI(R|S2) (gray). Black dots represent two responses that, for each stimulus, have the same NI likelihoods (and are thus mapped onto the same RNIL). Right, Contour curves of P(S1|R) (black) and P(S2|R) (gray) passing through the responses denoted in the left panel (continuous and dashed lines, respectively). C, The NI assumption merges pairs of responses R that are symmetric with respect to the diagonal (left, dashed line). Because these pairs also have the same posterior probabilities (right), Equation 23 is fulfilled and no information is lost. F, The NI assumption merges pairs of responses R that are symmetric with respect to the line R1 = 5 (left, dashed line). These pairs have different posterior probabilities (right). Therefore, Equation 23 is not fulfilled and some information is lost.

