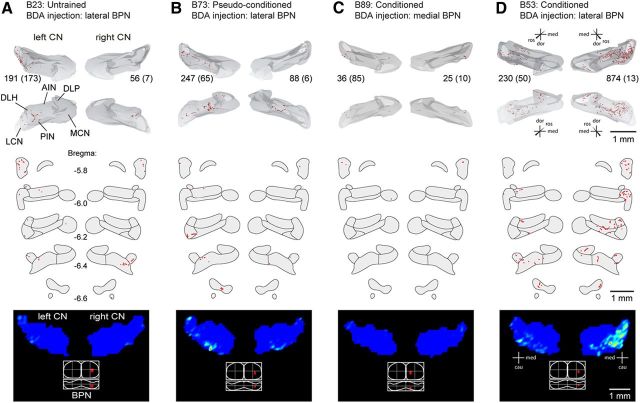
Figure 5.
Differences in collateralization of pontine mossy fibers after conditioning. Four examples of each experimental group are shown. Top, Three-dimensional reconstruction based on every other section through the CN. The bottom pair of reconstructions represent caudal view of the left and right hand nuclei; the top pair represents an inverted rostral view. Numbers between reconstruction pairs indicate number of plotted varicosities and number of labeled fibers within the MCP (between brackets). Middle, Labeled varicosities in the bilateral CN plotted in standardized sections going from bregma −5.8 to −6.6 mm. Bottom, Dorsal view of the CN showing the density profile determined from counting the number of plotted varicosities in mediolateral bins of 80 μm wide per section and visualized with MATLAB routines. Bottom shows a dorsal and caudal view of the BPN with a representation of the injection site. Note that, in all groups, the number of labeled fibers is highest in the contralateral MCP. The number of plotted varicosities/labeled fibers is highest ipsilaterally of the conditioned eye. Scale bars, 1 mm. DLP, Dorsolateral protuberance; MCN, medial cerebellar nucleus.

