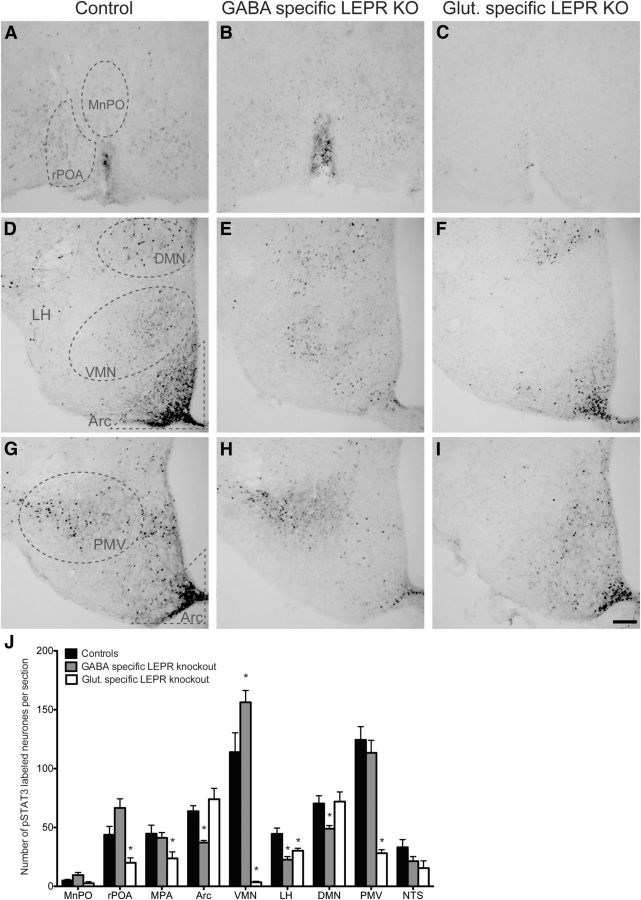
Figure 1.
Characterization of the knock-out models by labeling leptin-induced phosphorylated STAT3. A–I, Representative photomicrographs of staining in different hypothalamic areas counted. A–C, MnPO and rPOA. D–F, Arc, VMN, LH, and DMN. G–I, Arc and PMV. The first column shows leptin-induced (5 mg/kg) pSTAT3 labeling in control animals. Second and third columns show pSTAT3 labeling in GABA- and glutamate-specific LEPR knock-out animals, respectively. J, Quantification of immunohistochemical staining (number of positive labeled cells per section) in control animals (black bars; n = 11), GABA-specific (gray bars; n = 10), and glutamate-specific (white bars, n = 8; n = 2 for NTS) knock-outs. There was no difference between the pSTAT3 counts of the two control groups (n = 6 and n = 5) that are derived from the two different Cre lines; therefore, they have been pooled in this graph. In all regions, experimental groups are compared with the control animals to show significant differences. MnPO includes the region of the organum vasculosum of the lamina terminalis (OVLT); rPOA, ventral part. Scale bar, 100 μm. *p < 0.05.

