Figure 3.
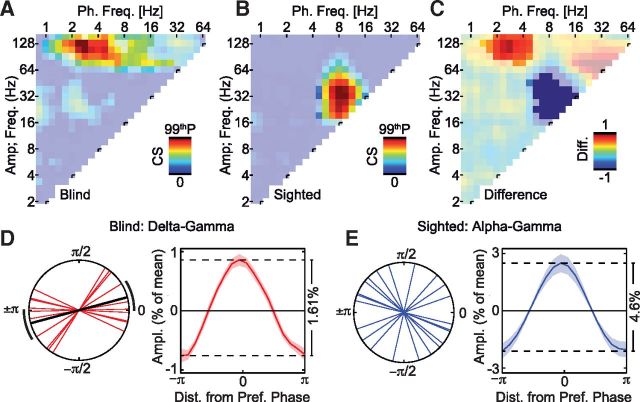
Cross-frequency phase–amplitude coupling in early visual areas dissociates between the blind and the sighted. A, Average cross-frequency CS for all phase and amplitude pairs for the blind. The color-saturated area shows a significant cluster of cross-frequency coupling, p < 0.05.The color axis is scaled to the 99th percentile of the coupling strength occurring across all frequency pairs, cs99p = 0.66. B, Same as A, but for sighted control subjects. cs99p = 2.14. C, Difference in cross-frequency coupling strength between the groups for all phase and amplitude frequency pairs. The color-saturated areas show clusters with a significant difference between groups, p < 0.05. D, Principal phase axes and phase-sorted amplitude histogram for the delta–gamma coupling found to be significantly stronger in the blind (see warm-colored cluster in C). The black lines indicate the significant mean phase axis with its 95% confidence interval. The phase-sorted amplitude histogram shown as the mean across the group ± SEM. E, Same as D, but for the sighted control subjects, and the alpha–gamma cross-frequency coupling was found to be significantly stronger in the sighted (see cold-colored cluster in C). No significant main-phase axis was found across the group.

