Figure 4.
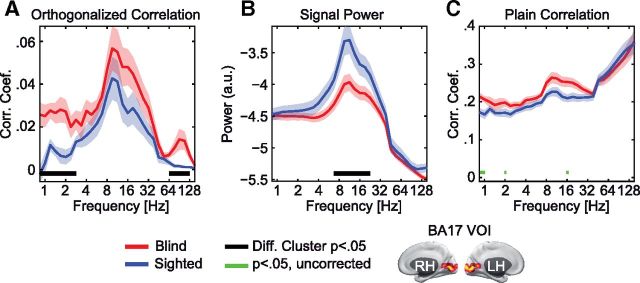
Local signal power shows a double dissociation from power correlations. A, Average orthogonalized power correlation between visual source locations within BA17 for the blind (red) and sighted (blue). Data are shown as the group mean ± SEM. Significant clusters of differences between blind and sighted individuals across frequencies are marked as black lines, p < 0.05. B, Average power spectra for blind (red) and sighted (blue) individuals at visual source locations within BA17 for blind (red) and sighted (blue) individuals. Data are shown as the mean ± SEM. Clusters with a significant difference between groups (p < 0.05) are shown as in A. C, Differences in power correlations were not detectable without signal orthogonalization. Average power correlation between source locations without signal orthogonalization for the blind (red) and sighted (blue). Data are shown as the mean ± SEM. No significant cluster of differences was found. Individual tests that were significant at an uncorrected level are shown as green bars (Wilcoxon rank-sum test, p < 0.05).

