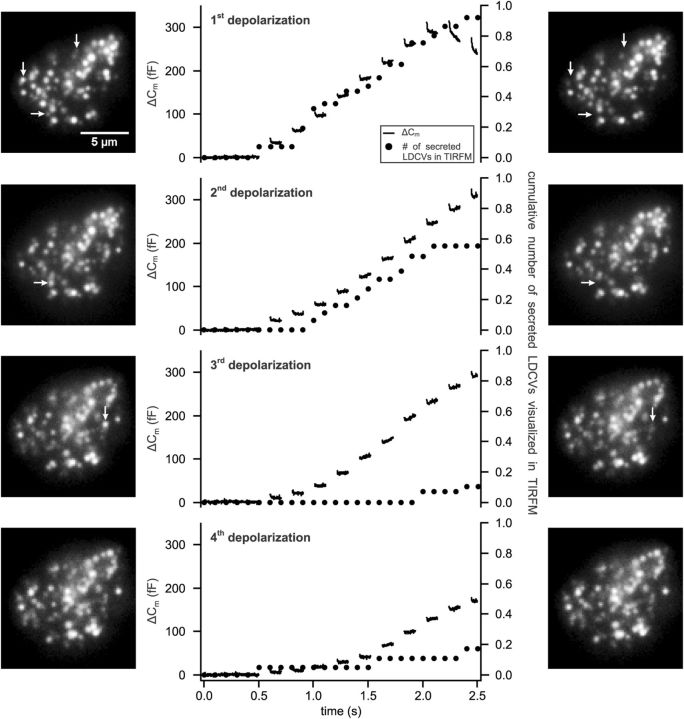
Figure 1.
Several rounds of depolarizations cannot deplete all LDCVs at the PM. Cells were stimulated with 4 trains of 10 depolarizations to 0 mV each lasting 100 ms at 5 Hz (holding potential: −70 mV) every 2 min. Secretion was measured via membrane capacitance recording and visualized with TIRFM. Shown is the average membrane capacitance increase (ΔCm, lines) and the averaged cumulative number of exocytotic events visualized by TIRFM normalized to the footprint area of the cell in TIRFM (dots). See the Materials and Methods section for more details on the normalization procedure. Pictures show the footprint of one exemplary cell in TIRFM taken immediately before (left row) and after (right row) the stimulus. Arrows mark secreted vesicles upon stimulation (n = 22).

