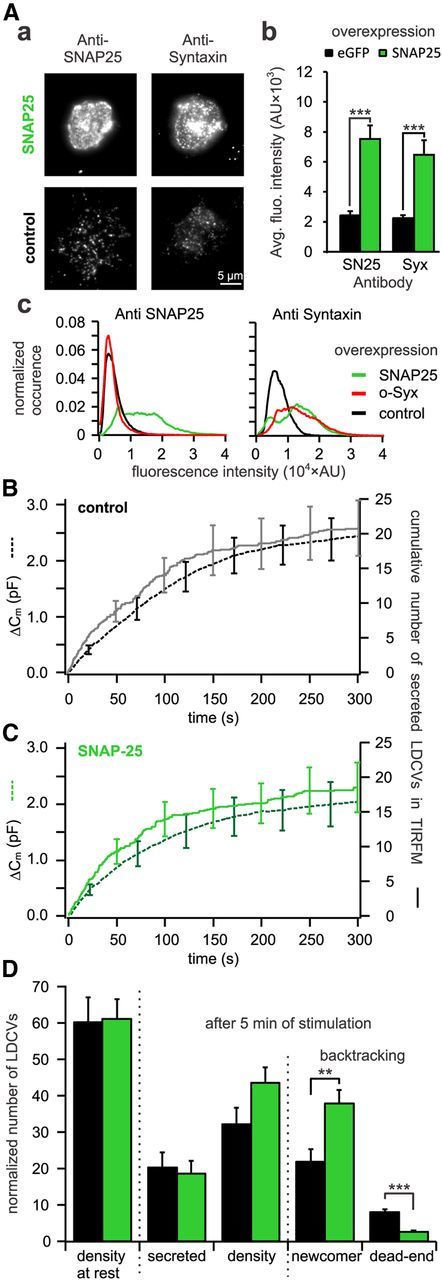
Figure 9.

Overexpression of SNAP-25 decreases the number of dead-end vesicles by 67%. A, Quantitative immunocytochemistry to assess the difference in SNAP-25 and syntaxin insertion in the PM upon open-syntaxin overexpression. Aa, TIRFM images of anti-syntaxin and anti-SNAP-25 labeled cells either overexpressing open-syntaxin (top) or not (bottom). Ab, Average fluorescence intensity of syntaxin and SNAP-25 immunolabeling in the PM. For both proteins the fluorescence intensities were significantly increased in SNAP-25 overexpressing cells as compared with control (***p ≤ 0.001, n = 10 for control and SNAP-25 overexpressing cells). Ac, Average fluorescence intensity histograms of the TIRFM picture of the SNAP-25 (left) and syntaxin (right) immunostaining. They were normalized to the surface area of the individual footprints of the cells. Note that upon overexpression of the stained protein the respective histogram is right shifted toward higher values compared with control. Interestingly, upon overexpression of SNAP-25, the histogram of syntaxin immunofluorescence is not only right shifted but changes its shape from a unimodal to a bimodal distribution indicating different protein clustering. B, C, Cells cotransfected with NPY-mCherry and eGFP (B) or together with SNAP-25 (C) were patched with 6 μm free [Ca2+] in the pipette solution. Shown are the average membrane capacitance increase (stippled line) and the cumulative number of secreted LDCVs visualized in TIRFM normalized to the footprint area (solid line). D, Analysis of TIRFM recording in cells overexpressing SNAP-25 (green) or control cells (black). Represented are the average density of LDCVs near the PM at the beginning and the end of the experiment and the average total secretion. LDCVs visible in TIRFM at the end of the experiment were separated between newcomer and dead-end vesicles (n = 14 and n = 13 for SNAP-25 overexpressing and control cells, respectively; **p < 0.01; ***p < 0.001). See Materials and Methods for details on the normalization procedure.
