
Figure 4.
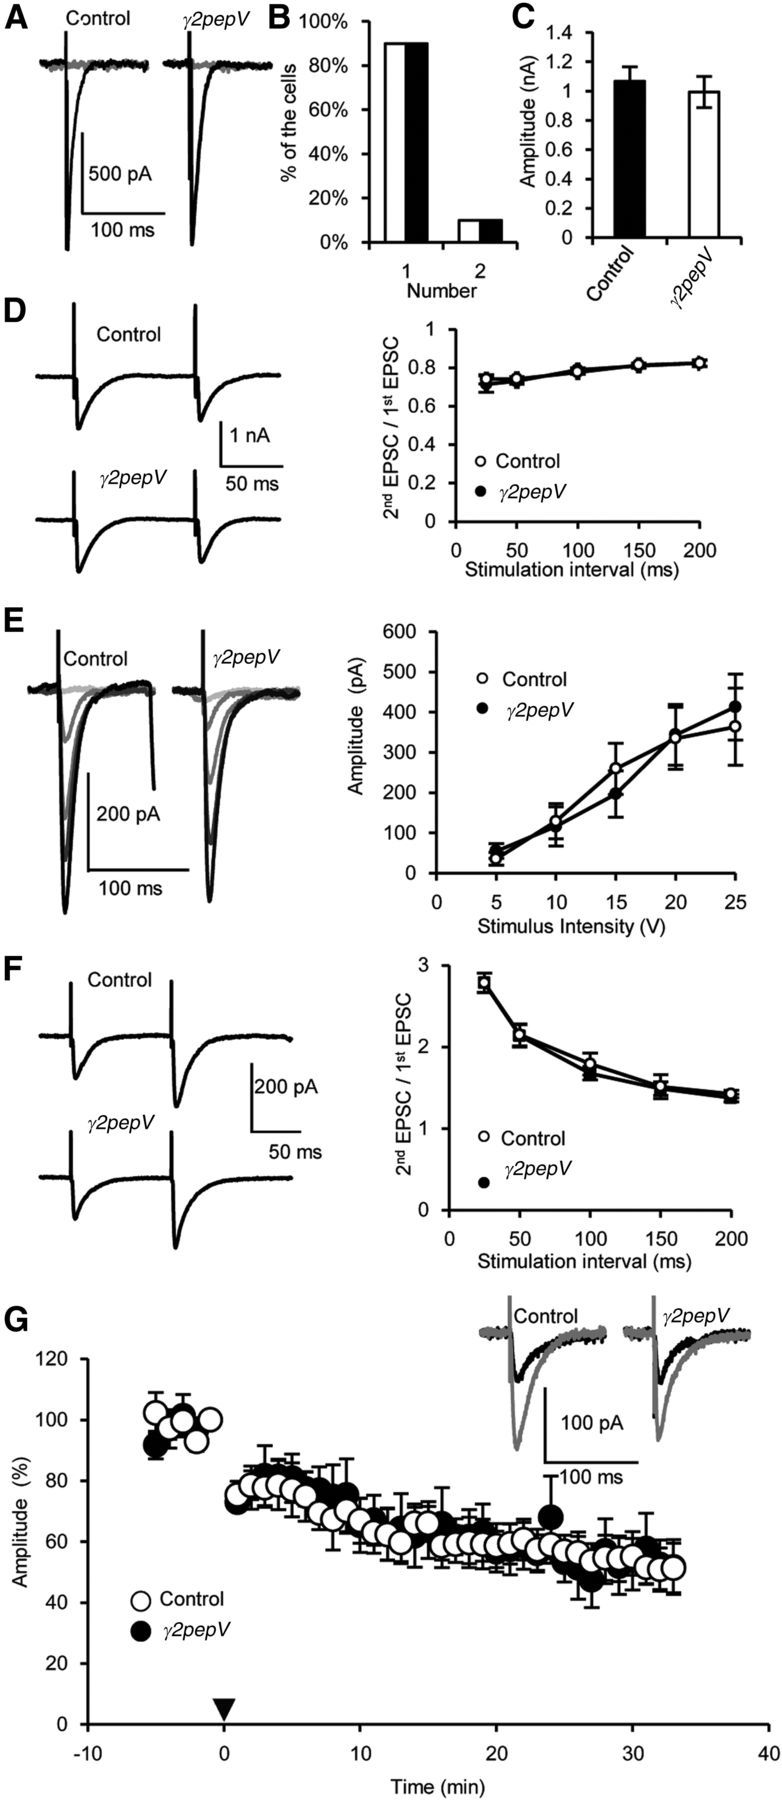
Excitatory synaptic inputs to PNs. A–C, Representative traces (A), the numbers of amplitude steps (B), and the maximum amplitudes of CF-EPSCs (C) (n = 20 for each). D, Representative traces of paired CF-EPSCs and the amplitude of the second EPSC divided by that of the first (n = 10 for each). E, Representative traces and amplitudes of PF-EPSCs versus the stimulus intensity (n = 9 for each). F, Representative traces of paired PF-EPCs and the amplitude of the second EPSC divided by that of the first (n = 10 for each). G, Time courses of averaged PF-EPSC amplitudes before and after the LTD induction (0 min, arrowhead, n = 5 for each). PF-EPSC amplitudes were normalized, taking the mean value between −1 and 0 min as 100%. Representative PF-EPSCs recorded before (gray) and 30 min after (black) the LTD induction were shown. Data are mean ± SEM.