
Figure 5.
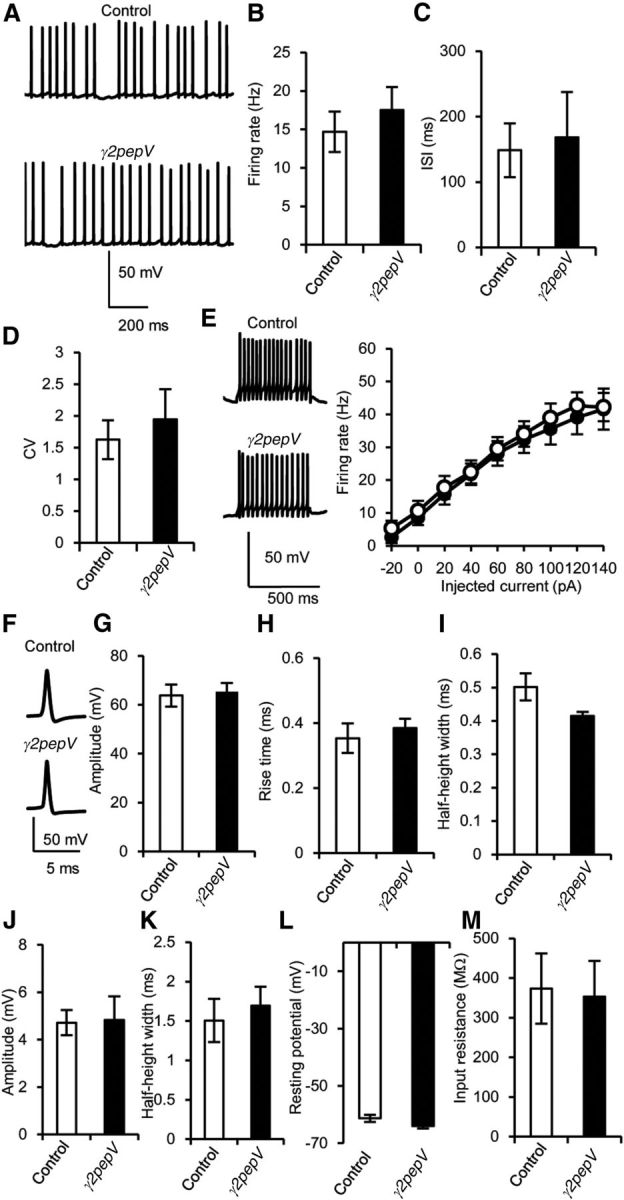
Intrinsic excitability of PNs. A, Representative traces of simple spikes. B–D, Firing rate (B), interspike interval (ISI, C), and coefficient of variation of ISI (CV, D) in current-clamp recordings (n = 20 for each). E, Representative voltage responses to 500 ms constant current injection (140 pA), and the firing rate against the intensity of injected current (n = 10). F–I, Representative traces (F), amplitudes (G), 10–90% rise times (H), and half-height widths (I) of action potential (n = 7 for each). F, Each action potential trace is an average of 10 events. J, K, Amplitudes (J) and half-height widths (K) of after-hyperpolarization (n = 7 for each). L, M, Resting membrane potential (L) and input resistance (M) of PNs. Data are mean ± SEM. There was no significant difference in any of the values between the genotypes (unpaired t test).