
Figure 6.
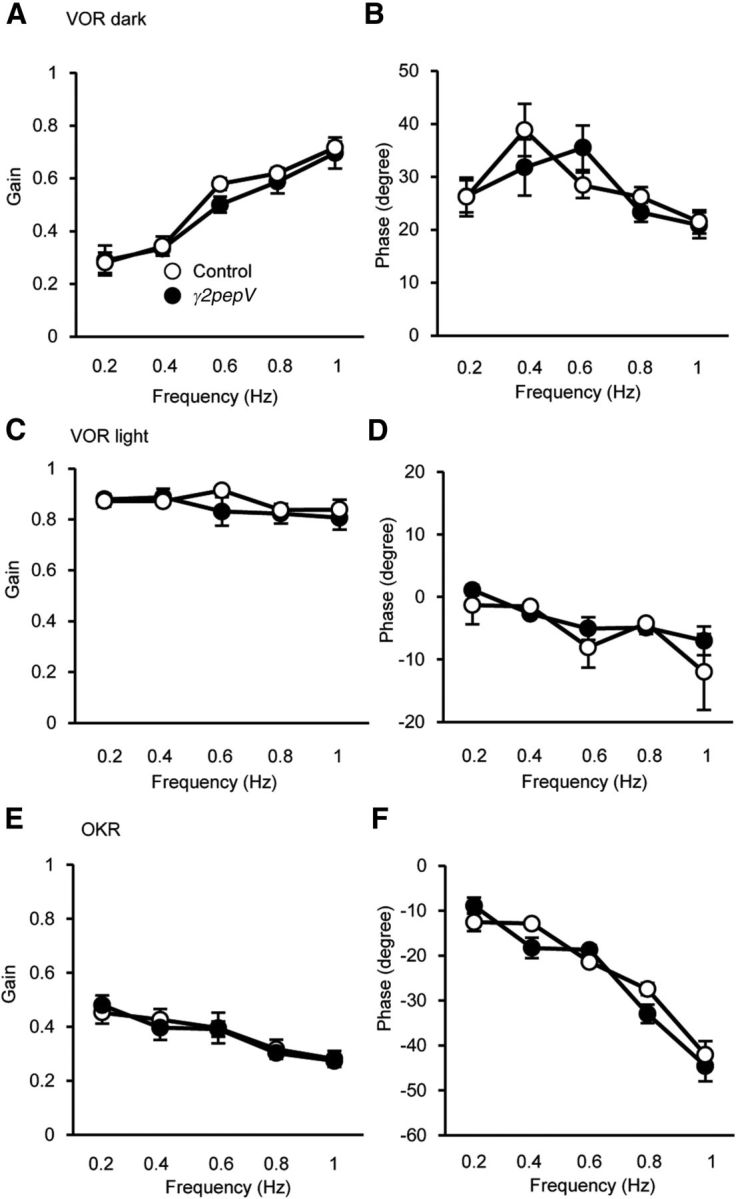
Baseline dynamic properties of VOR and OKR in γ2pepV mice. VOR in the dark (A, B), VOR in the light (C, D), and OKR (E, F) in γ2pepV (n = 5) and control (n = 5) mice. Gain (A, C, E) and phase (B, D, F) values of the eye movement relative to head or screen rotation are plotted versus the stimulus frequency. Data are mean ± SEM.