
Figure 8.
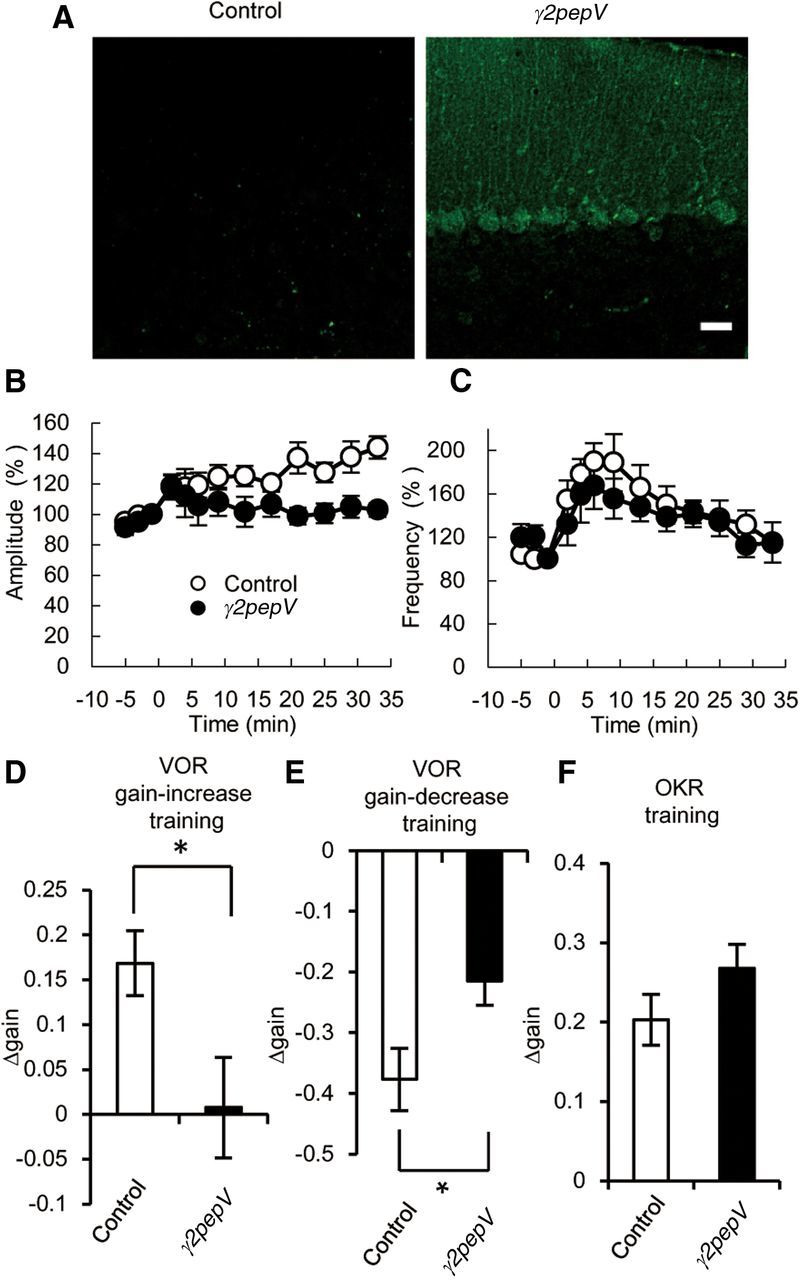
Phenotypes of γ2pepV line B mice. A, Cerebellar slices stained with an antibody against Venus (green). Scale bar, 25 μm. B, C, The time courses of averaged mIPSC amplitudes (B) and frequencies (C) before and after the conditioning depolarization (n = 5 for each). The conditioning depolarization was applied at 0 min. D–F, The differences of gain between before and after the gain-increase VOR training (n = 10 for each) (D), the gain-decrease VOR training (n = 8 for each) (E), or the OKR training (n = 10 for each) (F). Data are mean ± SEM. *p < 0.05.