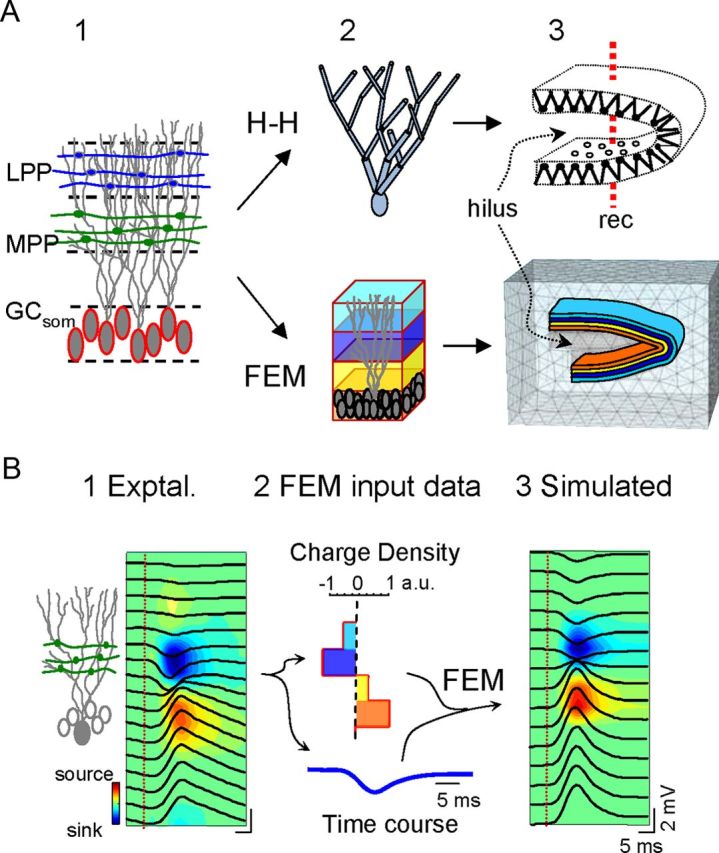
Figure 1.

Model reproduction of LFPs in the DG from known synaptic inputs to somato-dendritic domains of GCs. A, Two different approaches were used to address complementary aspects of LFP generation, either using a U-folded layer aggregate of compartmental GCs with explicit membrane electrogenesis and Hodgkin–Huxley kinetics (H–H), or by a FEM that uses predefined volumetric current sources. The compartmental model is best suited to simulate realistic interaction between synaptic inputs in individual cells, and the resultant spatial distribution of transmembrane currents giving rise to macroscopic LFPs. These were estimated in points along a simulated track of recording (A3). Three main synaptic inputs were simulated: the excitatory LPP, MPP, and a somatically targeting inhibition GCsom. In the FEM approach, the gross cytoarchitecture of the GC population (A1) was represented by four stacked rectangular blocks of current, each representing a subcellular domain: one for the somata (bottom block) and three for the dendrites in the stratum moleculare (A2). The blocks were assigned appropriate curvature and dimensions to reproduce a prototypic U-shaped GC population with a central plane of symmetry and slight blade asymmetry (the top blade was longer than the bottom blade). A tetrahedron adaptive recording mesh simulating the conductive extracellular medium was built in and around the cellular component. Note the denser tetrahedron mesh in the cellular component and the interposed region (i.e., the hilus). B, In the FEM model, the block sources required predefined values. By default, we used experimentally obtained spatial distributions and temporal activations from the excitatory MPP. B1 shows the depth profile of an evoked subthreshold fEPSP superimposed to the contour plot of current sources (blue) and sinks (warm colors) estimated by CSD analysis. The charge was distributed throughout all four compartments with identical time course and was balanced at all instants (B2). B3, FEM simulated data. CSD and charge density are given in normalized arbitrary units (a.u.). Vertical red lines indicate the stimulus time.
