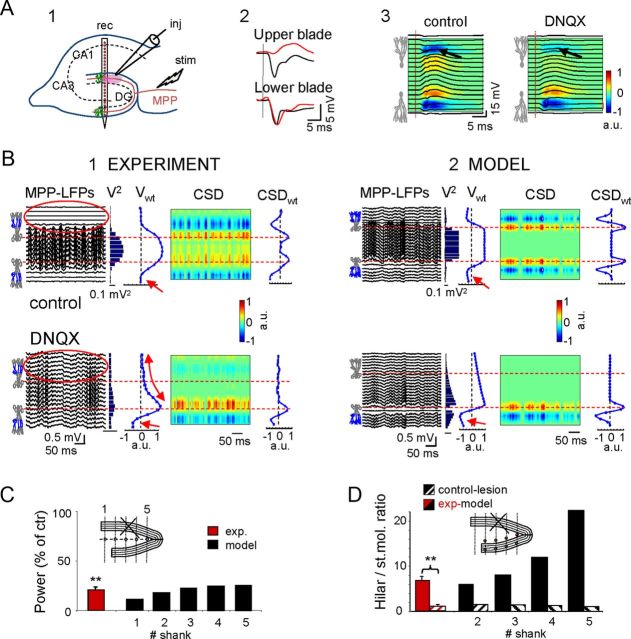
Figure 6.
Deactivation of one blade in vivo and in the computational model converts the DG into a functionally planar structure. A1, Electrode arrangement for the experimental blockade of MPP potentials by local administration of DNQX in the top blade via an injecting/recording pipette (inj) positioned close to the linear probe (rec). A2, MPP-evoked fEPSPs selectively disappeared in the top blade (black and red potentials pertain to vehicle and DNQX administration in the bottom blade, respectively). A3, Superimposed field potentials and CSD across the hilus and cell layers. Note the near complete disappearance of the synaptic sink upon DNQX administration (arrows). B, The top and bottom rows show the results for vehicle versus DNQX treatment (B1) and deactivation of the upper blade in the model (B2), respectively. Similar results were obtained using both approaches. Note the strong reduction of LFP power in the hilus (V2), and the modification of the spatial distribution of MPP potentials (Vwt), which resembled synaptic activation in a single planar layer (linear decay from the active blade). The nonlinear decay observed in vivo (curved arrow) was probably due to incomplete layer ablation by the drug. Despite the intact CSDwt distribution in the lower blade, the local synaptic sites increased in amplitude (small red arrows) due to reduced cancellation by the absence of positive potentials from the other layer. Note that LFPs were also evident in the deactivated blade (compare red ovals), as the current reached this location volume-conducted through the hilus from the distant active blade. No reversal of polarity was observed for these LFPs. C, Power of the hilar LFPs in experiments and in the model after lesion/inactivation of the top blade expressed as the percentage of control. C, Inset, The sites (in blue) used for estimations in the model. D, Hilar to stratum moleculare ratio of the field potential amplitude in control (homogeneous activation in the two blades) and after inactivation of the top blade. D, Inset, The pairs of sites used for estimation (300 μm apart along recording tracks). Note the increasing boosting effect toward the apex in control and the nearly complete linearization after the inactivation of the top blade (lesion), which then reached values close to 1. C, D, **p < 0.01; Student's t test, n = 4 animals.

