Figure 2.
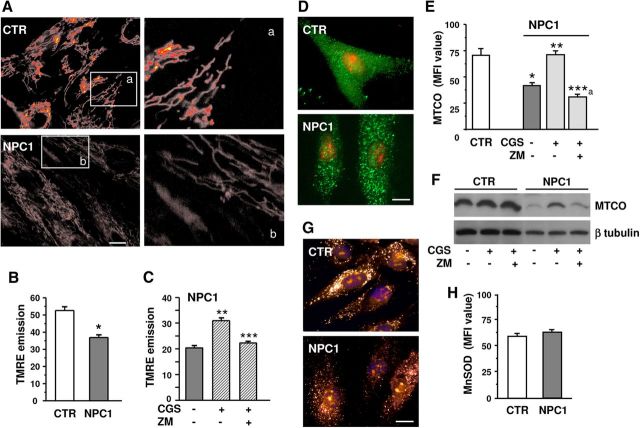
Effect of A2AR stimulation on mMP and MTCO. A, Photomicrographs showing TMRE-loaded fibroblasts from healthy (CTR, top) or NPC1 (bottom). Scale bar, 15 μm. Right, High-magnificationimages of insets a and b. B, C, Average TMRE-fluorescence intensities as a measure of mMP in healthy and NPC1 fibroblasts; cells were exposed to CGS21680 (CGS) and ZM241385 (ZM) for 24 h (n = 3 clones/group; from n = 57 to n = 362 mitochondria per each single clone). D–G, Healthy and NPC1 fibroblasts were treated for 24 h with CGS21680 with or without cotreatment with ZM241385. Cells were immunolabeled for MTCO (D) or MnSOD (G). Nuclei were labeled with propidium iodide (red) in D and Hoechst 33258 (blue) in G. Scale bar, 20 μm. Mean fluorescence intensities are shown in E and H. Data are mean ± SEM of n = 50–60 cells from each clone, as described in B. F, MTCO Western blot analysis of healthy and NPC1 fibroblasts cultured as described in C. One representative clone for each group is shown. *p < 0.05 versus control fibroblasts; **p < 0.05 versus untreated and CGS+ZM-treated NPC1 fibroblasts; ***p < 0.05 versus CGS; ***a p < 0.05 versus CGS and untreated NPC1.

