
Figure 2.
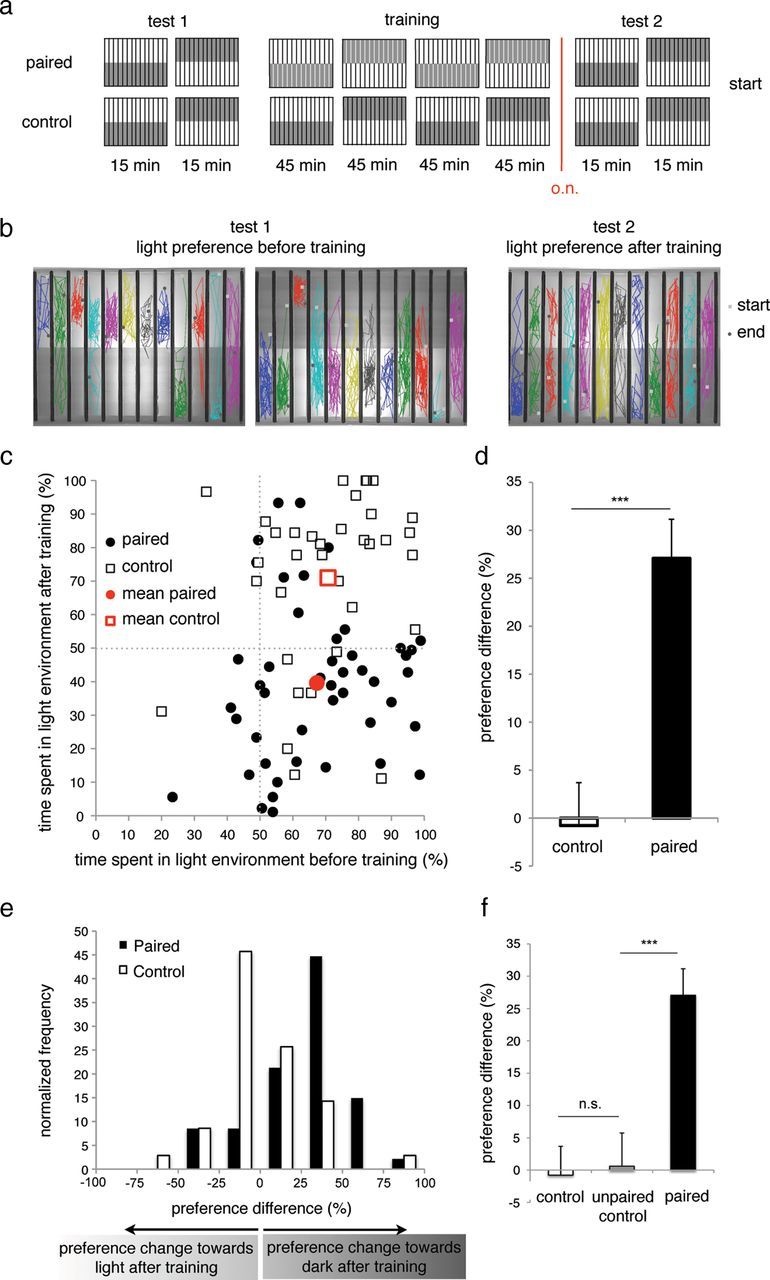
Associative place-conditioning in larval zebrafish. a, Associative place-conditioning paradigm. Unconditioned light preference was determined during Test 1, followed by a 3 h training period during which dark and social environment were paired. Light preference after conditioning was determined during Test 2, 14 h after training. Control fish were exposed to the same pattern of light and dark environments but no social environment. b, Sample position traces of individual larval zebrafish during Test 1, showing unconditioned light preference, and Test 2, 14 h after training, showing conditioned place preference. Light and gray squares represent position of individual larvae in the first and last frames, respectively. c, Percentage of time spent in the light environment before (x-axis) and after (y-axis) training of unpaired (black) and control (white) larvae. Red markers represent mean light preference. d, The preference difference (%) of experimental (black) and control (white) groups; positive values indicate a relative preference for the dark area of the chamber after training. Error bars indicate SEM. ***p < 0.001 and Cohen's d ≥ 0.8. n = 35–47 per condition. e, Preference difference distribution of experimental (black) and control (white) groups. f, Light preference difference of experimental (black), control (white), and unpaired control (gray). Error bars indicate SEM. ***p < 0.001 and Cohen's d ≥ 0.8. n = 35–48 per condition. n.s., Not significant; o.n., overnight.