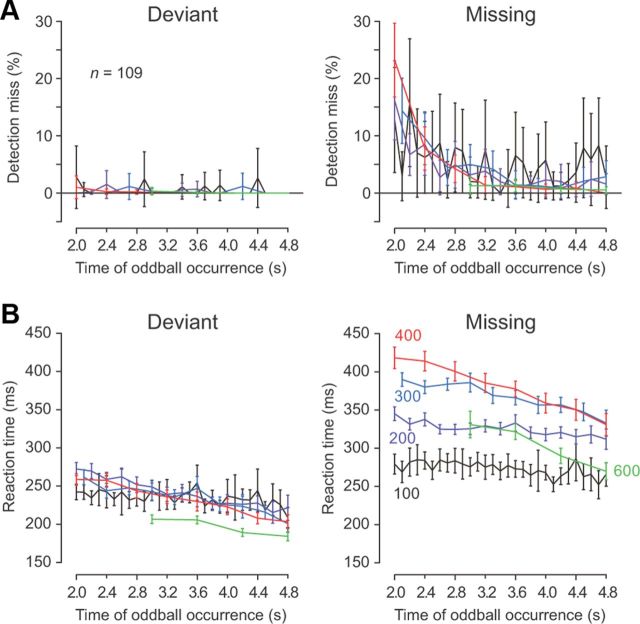
Figure 10.
Behavioral data for the oddball detection task during recording sessions (n = 109). A, Mean and 95% confidence intervals of the rate of detection error are plotted as a function of the time of the oddball from the first stimulus. Data from different oddball conditions (deviant and missing) are shown separately. Note that detection errors were more frequently observed with earlier occurring missing oddballs. B, Mean and 95% confidence intervals of saccade latency as a function of the time of oddball occurrence. For all panels, different colors indicate different ISIs.

