
Figure 2.
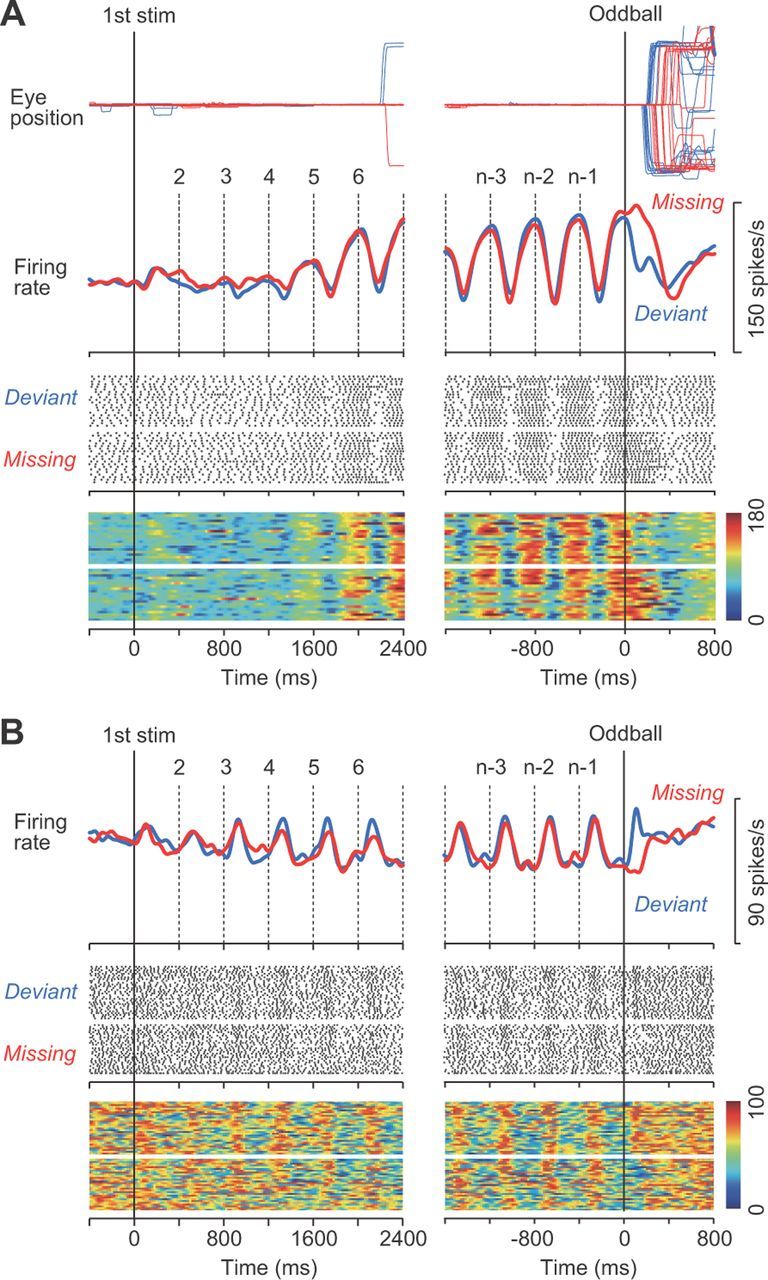
A, Data from a representative neuron aligned with either the first stimulus (left) or the oddball (right). Traces of eye position and spike density for different conditions are shown in different colors. Vertical dashed lines indicate stimulus timing. For presentation purposes only, the dots on the raster display are shown only for the timing of the first of five consecutive spikes. The bottom heat maps indicate spike density computed for individual trials to show the consistency of firing modulation across trials. B, Another example exhibiting an increase of firing rate for each stimulus. For this neuron, the rasters indicate the timing of the first of three consecutive spikes. stim, Stimulus.