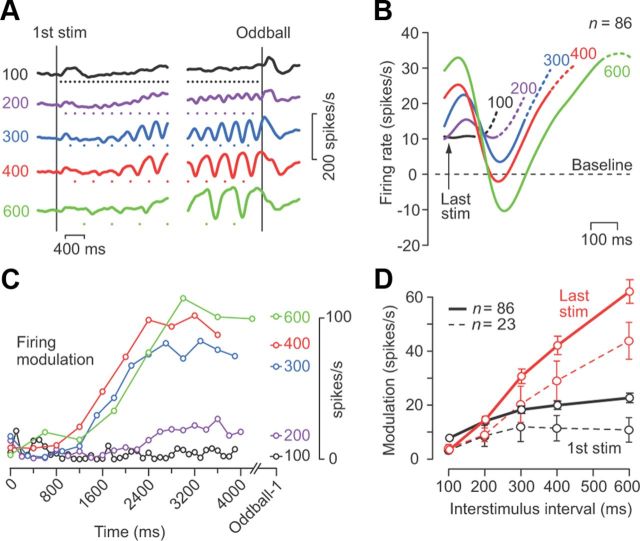
Figure 3.
Linear relationship between sensory gain and ISI. A, Time courses of firing rate for different ISIs for the neuron shown in Figure 2A. The number on each trace indicates ISI. Stimulus timing is denoted by a dot. B, Population activity for 86 neurons that showed a reduced firing rate for each stimulus. Continuous traces are aligned with the stimulus immediately before the oddball (denoted as the last stimulus). For each neuron, the baseline activity immediately before the first stimulus was subtracted. Dotted traces indicate the data during the 100 ms interval following the oddball (i.e., when a missing stimulus should have occurred or a deviant stimulus did occur). C, The magnitude of firing modulation during each ISI as a function of time after the first stimulus for the neuron in A. The right-hand column indicates the data for the stimulus just before the oddball. D, Mean and 95% confidence intervals of the magnitude of the response to the first (black) and the last (red) stimulus for different ISIs. The data connected with solid lines indicate 86 neurons with a transient decrease in activity, while those connected with broken lines indicate 23 neurons with a transient increase in activity for each stimulus. stim, Stimulus.

