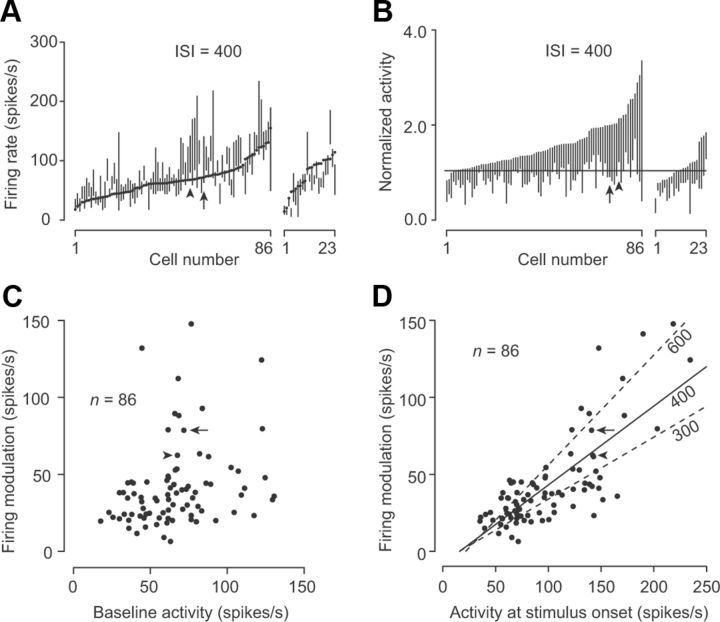
Figure 4.
Comparison of the range of neuronal modulation and baseline activity. A, Minimal and maximal firing rates in the ISI immediately before the oddball in trials with 400 ms ISIs are shown as a line for each neuron. The baseline activity (500 ms before the first stimulus) is denoted by a dot. Data are sorted according to the baseline activity for 86 neurons with decreased activity following each stimulus (left) and 23 neurons with increased activity following each stimulus (right). The neurons shown in Figures 2A and 7A are indicated by an arrow and arrowhead, respectively. B, Firing modulation normalized to the baseline activity. Data are sorted according to the maximal activity. Note that many neurons exhibited firing rates less than the baseline. C, Scatter plot comparing the firing modulation and baseline activity for individual neurons. Two outliers were omitted ([70, 156], [155, 141]). D, Comparison between the magnitude of firing modulation and activity at the stimulus onset. The solid line indicates the regression line for the data in trials with 400 ms ISIs, while the dashed lines indicate those for trials with 300 and 600 ms ISIs. One outlier has been omitted ([210, 156]).

