
Figure 5.
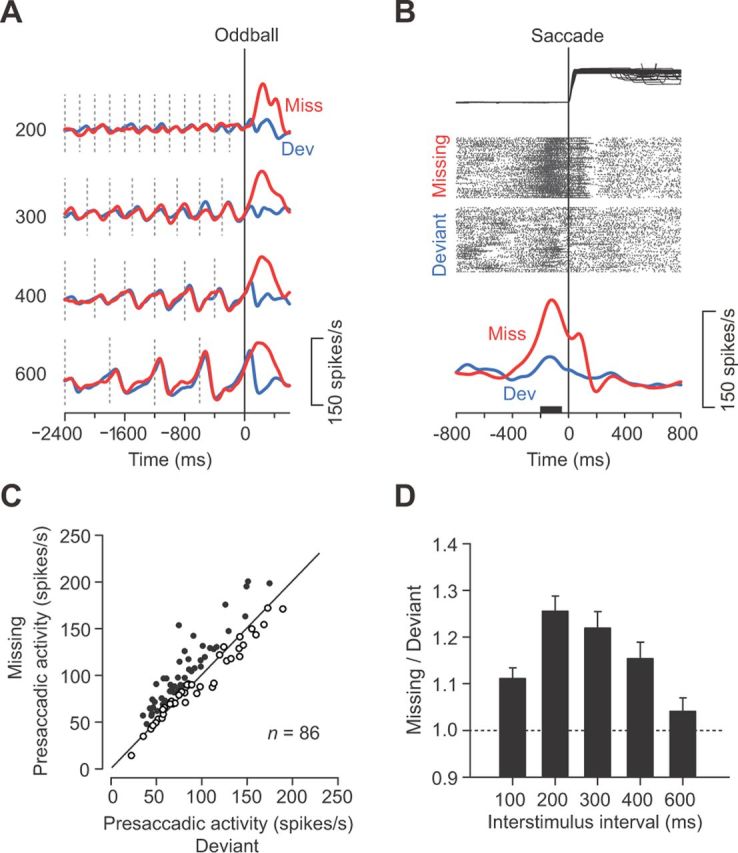
Enhanced activity for the missing oddball. A, Traces of spike density for a representative neuron in trials with different ISIs. Red and blue traces show the data for the missing and deviant conditions, respectively. Vertical dashed lines indicate stimulus timing. Note that this neuron exhibited a greater response to the missing than the deviant oddball. B, Data in A are realigned according to the initiation of saccades. Although eye position traces are shown only for ipsiversive saccades, the neuronal data are combined for saccades in both directions. C, Comparison of presaccadic activity for individual neurons. The firing rate was measured for a 150 ms interval starting from 200 ms before saccade initiation (black bar in B). Approximately 55% of neurons (47 of 86 neurons) with a suppressive response to each stimulus showed greater activity for the missing than the deviant oddball trials (filled symbols; unpaired t test, p < 0.05). D, Means and 95% confidence intervals of the ratio of presaccadic activity (missing divided by deviant) for different ISIs. All but the left bar represent data for 86 neurons (n = 66 for 100 ms ISIs).