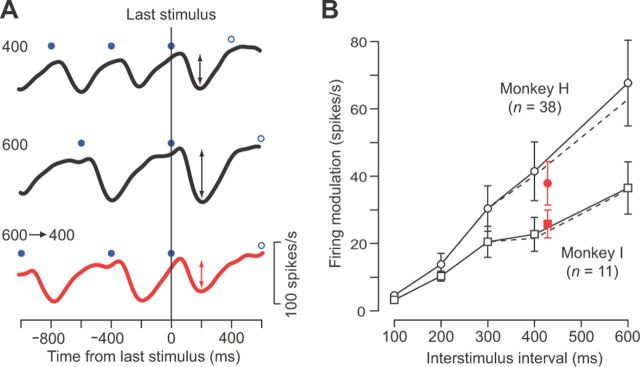
Figure 6.
Neuronal response to an unexpectedly early stimulus. A, Time courses of neuronal activity for a representative neuron in regular trials with a 400 ms (top) or 600 ms (middle) ISI, and in trials containing an early stimulus (bottom). Trials with an early stimulus were randomly interleaved with regular trials. The early stimulus was presented 400 ms after the preceding stimulus and was positioned just before the deviant oddball in trials with a 600 ms ISI. Filled and open blue circles denote the timing of repetitive and oddball stimuli, respectively. Note that the response to the early stimulus (indicated by red arrows) was smaller than that to the preceding stimulus, but was comparable to the response in regular trials with a 400 ms ISI (black arrows on the top trace). B, Relationship between the firing modulation and ISI for trials with constant ISIs (black symbols) and with an early stimulus (red symbols). The error bars indicate 95% confidence intervals. For both monkeys, the magnitude of the response to the early stimulus was not different from that in the regular 400 ms ISI trials (unpaired t test, p > 0.05). We obtained a similar result when the measurement interval was limited to within 300 ms (100 or 200 ms for the two shortest ISIs) of the stimulus onset (dashed lines).

