Figure 8.
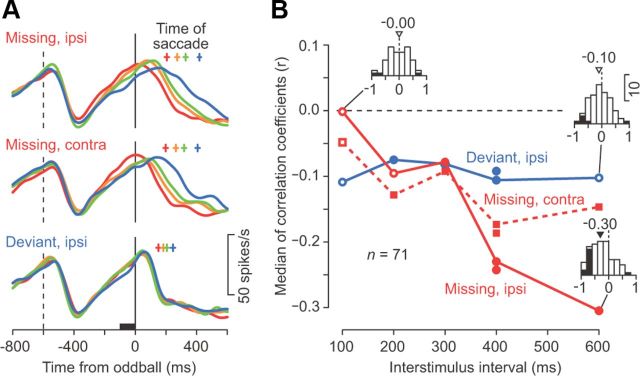
Correlation between neuronal activity just before the oddball and saccade latency. A, Time courses of population activity for ipsiversive missing oddball trials (top), contraversive missing oddball trials (middle), and ipsiversive deviant oddball trials (bottom) with 600 ms ISIs. For each neuron and condition, the data were divided into four groups according to saccade latencies. The population activity was computed for each of the four groups. Crosses above the traces indicate mean saccade latency for each group. B, Medians of the correlation coefficients computed between neuronal activity 100 ms before the oddball (black bar in A) and saccade latency in individual trials. The three data points without connecting lines indicate data for trials with only visual stimuli. Filled symbols indicate data showing a significant difference from zero (Wilcoxon signed-rank test, p < 0.05). The inset histograms indicate the sample distributions of the correlation coefficients. The arrowhead and number on each histogram indicate the median value. Note that the negative correlation was greatest for ipsiversive saccades in the missing oddball condition and was greater for longer ISIs.

