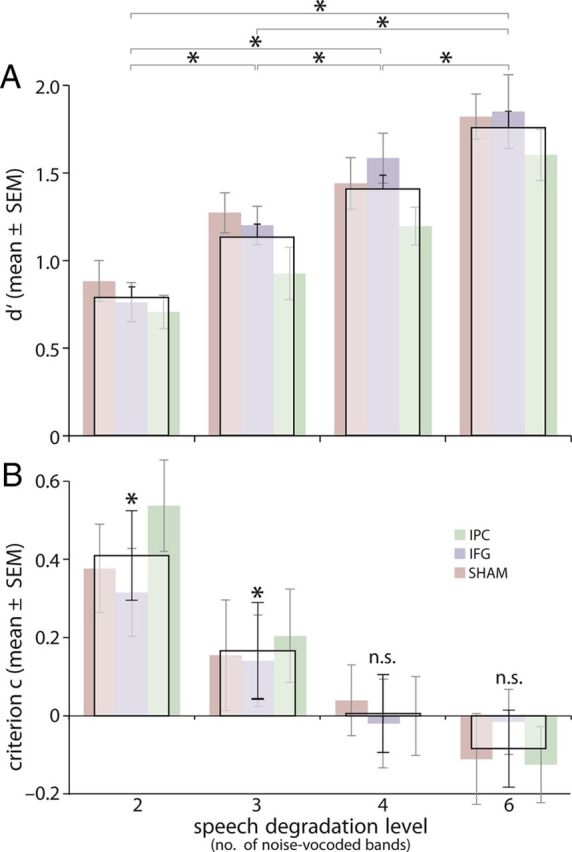
Figure 3.

Behavioral data at baseline (pretest). A, d′ decreased as a function of signal degradation (number of bands) in a roughly linear fashion. B, The amount of degradation influenced the participant's criterion, C: severely degraded speech (2 and 3 bands) led to a positive criterion; for example, subjects showed a response bias to judge pairs differently for severely degraded speech, but not for lesser degraded speech (4 and 6 bands). Wide columns, Mean of all participants (n = 36); narrow columns, mean per stimulation group (n = 12 each). Error bars indicate ±SE.
