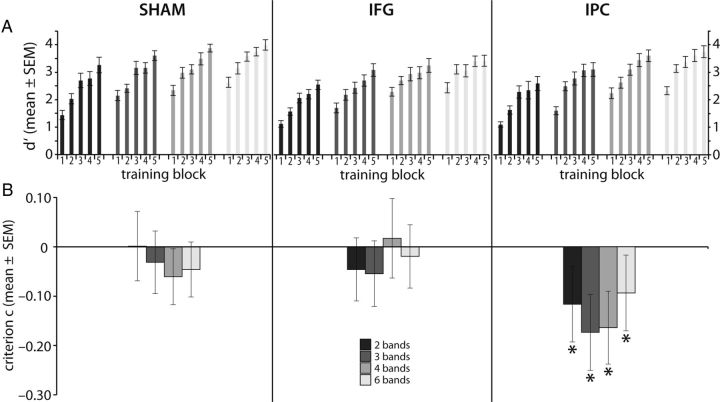
Figure 4.
Behavioral data of all subjects during the training. A, Graph shows improvements in d′ during five blocks of training (days 1–3) in the three different tDCS groups. More strongly degraded stimuli showed a steeper learning curve compared with the less degraded stimuli, as supported by a significant interaction of signal degradation and training block. B, Application of tDCS during training led to a modulation of C toward a more liberal response tendency in the IPC group only. No response bias (e.g., significant difference of C from zero) was found in the IFG or sham group. Error bars indicate ±SE.

