Figure 2.
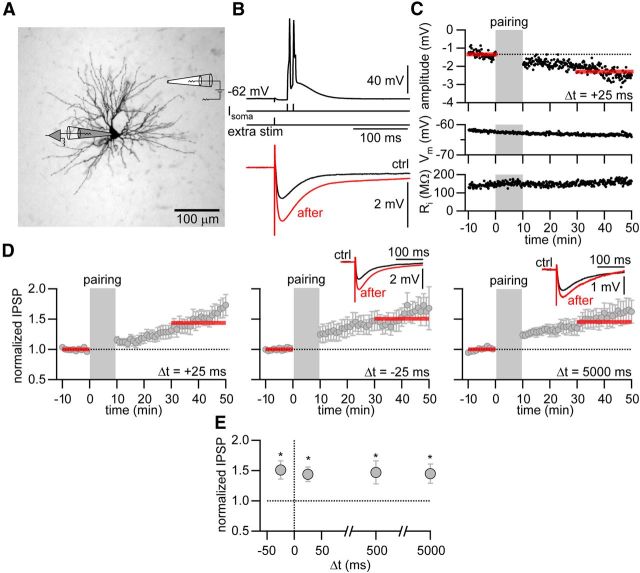
Non-Hebbian iLTP in thalamic relay neurons. A, Schematic recording configuration. Image represents a bright-field image of a biocytin-stained thalomocortical cell in the thalamic nucleus PoM. Gray represents recording electrode. Recording electrode is indicated in gray, extracellular stimulation electrode in white. Recordings from this cell are shown in B and C. B, Top, Illustration of the pairing protocol. Two postsynaptic current injections at 100 Hz evoking two APs on top of a low-threshold Ca2+ spike were paired with an IPSP (Δt = 25 ms). Bottom, Averaged IPSP during baseline (ctrl, black) and after iLTP induction (after, red). C, Example experiment with IPSP peak amplitude, membrane potential (Vm), and input resistance (Ri) plotted over time. Gray area represents pairing period (Δt = 25 ms). Red bars indicate time period for averaging IPSP amplitude. IPSP amplitudes are displayed as negative values. D, Normalized and averaged IPSP amplitudes over time. iLTP was induced with time delays of Δt = 25 ms, Δt = −25 ms, and Δt = 5 s. Insets, Representative averaged IPSPs during baseline (ctrl, black) and after iLTP induction (after, red). Positive time intervals (Δt) indicate the pairing of IPSPs with a following burst, whereas negative Δt indicate pairing of IPSPs with a preceding burst. E, Normalized change in IPSP amplitude after iLTP induction versus time delay Δt. *Significant LTP (p < 0.05).

