Figure 7.

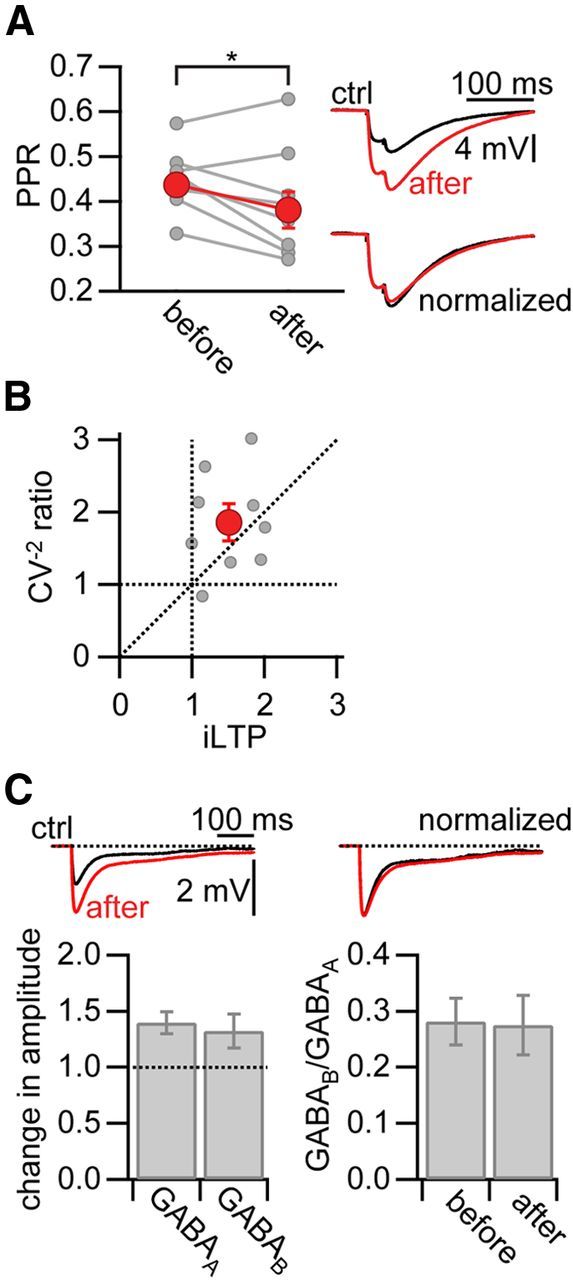
iLTP is expressed presynaptically. A, Left, PPR (amplitude of IPSP1/ IPSP2, 50 Hz) during baseline and after iLTP induction (Δt = 25 ms; data shown in Fig. 2D). Gray circles represent individual experiments. Red circles represent the averaged PPR. Right, Representative averaged IPSPs during baseline (ctrl, black) and after iLTP induction (after, red). *Significant difference (p < 0.05). B, Plot of the ratio of the coefficient of variation (CV−2) after the expression of LTP to the coefficient of variation during baseline versus the change in IPSP amplitude (iLTP). C, Left, Average change in IPSP amplitude for the GABAA and GABAB component (Δt = 25 ms). Right, Average of the GABAB-to-GABAA ratio before and after pairing.
