
Figure 1.
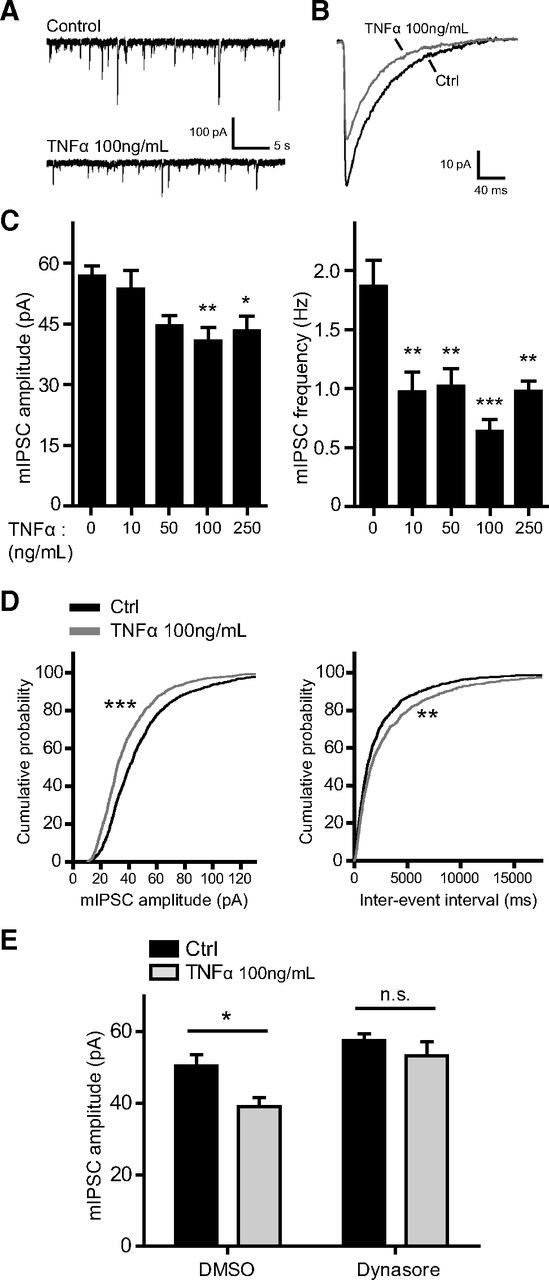
TNFα downregulates inhibitory synaptic strength via dynamin GTPase activity. A, Representative traces of mIPSC recordings from untreated (Control) and TNFα-treated cultured neurons (100 ng/ml, 45 min). B, Superimposed average mIPSC traces from an untreated neuron (Ctrl, black trace) and a TNFα-treated neuron (gray trace), showing a reduction in mIPSC amplitude in response to TNFα (100 ng/ml, 45 min). C, Group data showing a reduction of average mIPSC amplitude (left) and mIPSC frequency (right) in response to various concentrations of TNFα applied for 45 min (n = 14–23 cells in each condition; one-way ANOVA, Tukey's post hoc test, *p < 0.05, **p < 0.01, ***p < 0.001). D, Cumulative distribution plots of mIPSC amplitudes (left) and interevent intervals (right) from untreated (black traces) and TNFα-treated (100 ng/ml, 45 min; gray traces) neurons (∼1200 events from each condition; **p < 0.005, ***p < 0.0001, Kolmogorov–Smirnov test). E, Pretreatment with the dynamin GTPase inhibitor dynasore (80 μm) blocks the TNFα-induced (100 ng/ml, 45 min) reduction of mIPSC amplitude (n = 16–18 cells in each condition; two-way ANOVA, Bonferroni's post hoc test, *p < 0.05; n.s., not significant).