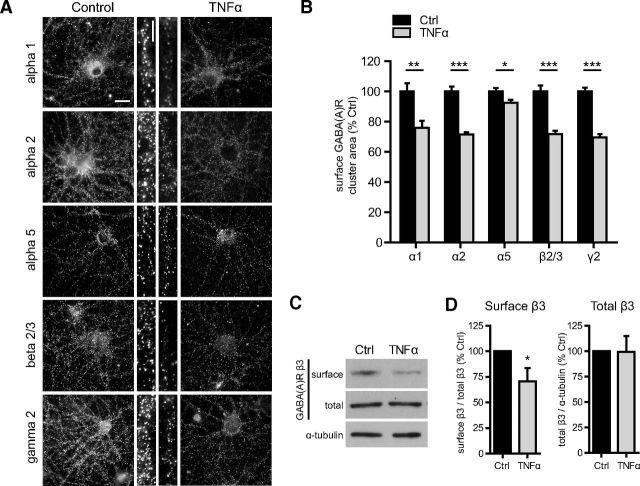
Figure 2.
TNFα downregulates cell-surface levels of GABAARs. A, Representative images of surface immunostaining for α1, α2, α5, β2/3, and γ2 GABAAR subunits in untreated (Control) and TNFα-treated (100 ng/ml, 45 min) cultures. Scale bars: low magnification, 20 μm; high magnification, 3 μm. B, Quantification data of subunit cluster area corresponding to subunits represented in A, showing a significant reduction in surface GABAARs in response to TNFα treatment (gray bars), for all subunits examined (α1, n = 119–120, **p < 0.01; α2, n = 189–261, ***p < 0.001; α5, n = 110–116, *p < 0.05; β2/3, n = 210–258, ***p < 0.001; γ2, n = 316–420, ***p < 0.001; all comparisons by two-tailed Student's t test). C, Representative Western blots of surface biotinylation assays comparing control and TNFα-treated (100 ng/ml, 45 min) cultures. D, Quantification of surface biotinylation assays showing a decrease in surface GABAAR β3 after TNFα treatment but no change in total β3 levels (n = 11 independent experiments; Mann–Whitney U test, *p < 0.05).

