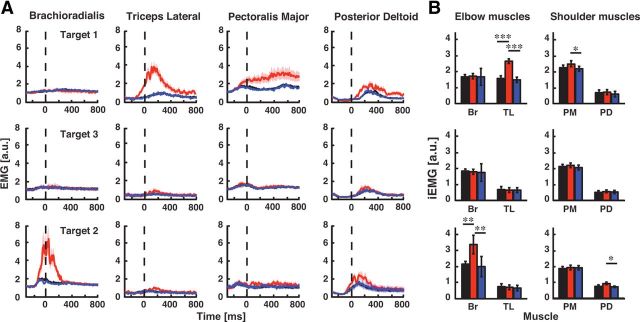
Figure 2.
Muscle activity and integrated EMG. A, EMG activity of four monoarticular arm muscles is shown for each reaching target during the baseline (black trace), adaptation (red trace), and washout phases (blue trace). Horizontal axis is the time relative to reach onset (dashed vertical line) and the vertical axis is normalized muscle activity (a.u.). Due to the normalization process, 1 a.u. corresponds to the level of muscle activity needed to stabilize against a 1 Nm constant load. EMG data are aligned to movement onset (0 ms) and the shaded region indicates the SEM. For display purposes, the EMG was smoothed using a 10 sample (10 ms) moving-average. B, Integrated EMG activity for the pair of antagonist muscles spanning the elbow and shoulder joints at each target. All values were obtained from the 300 ms window before movement onset. *p < 0.05, **p < 0.01, ***p < 0.001.

