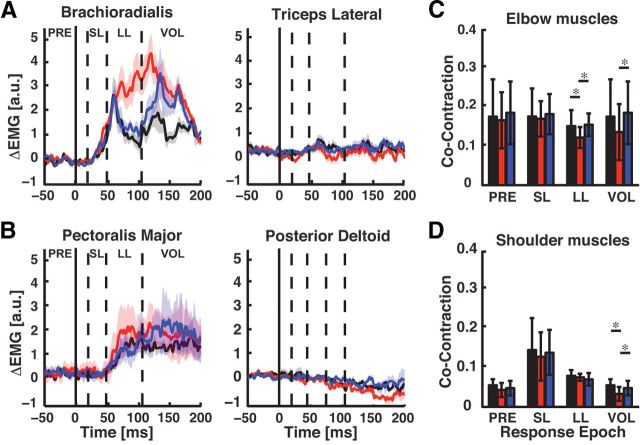
Figure 4.
Muscle stretch responses across the adaptation paradigm. A, Perturbation responses of the brachioradialis (left) and triceps lateral (right) muscles (mean ± SEM). Black, red, and blue traces correspond to brachioradialis stretch responses in the baseline, adaptation, and washout phases. Data are aligned to perturbation onset (t = 0 ms) and dashed vertical lines separate the different time phases of the stretch response. B, Pectoralis major and posterior deltoid stretch responses. Data are plotted in the same format as in B. C, Coactivation ratio between triceps lateral and brachioradialis during each phase of the stretch response. Color scheme is the same as in A and B. D, Coactivation ratio between pectoralis major and posterior deltoid stretch responses. Color scheme is the same as in C.

